with flowcytometry, cytogenetic and molecular biology findings
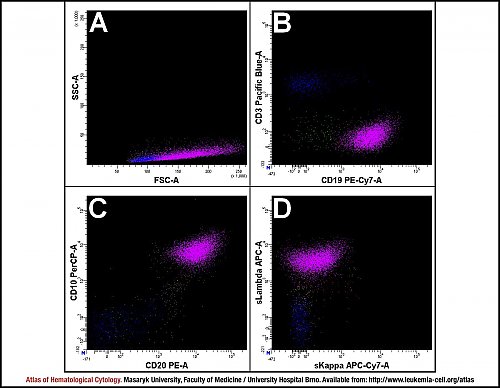
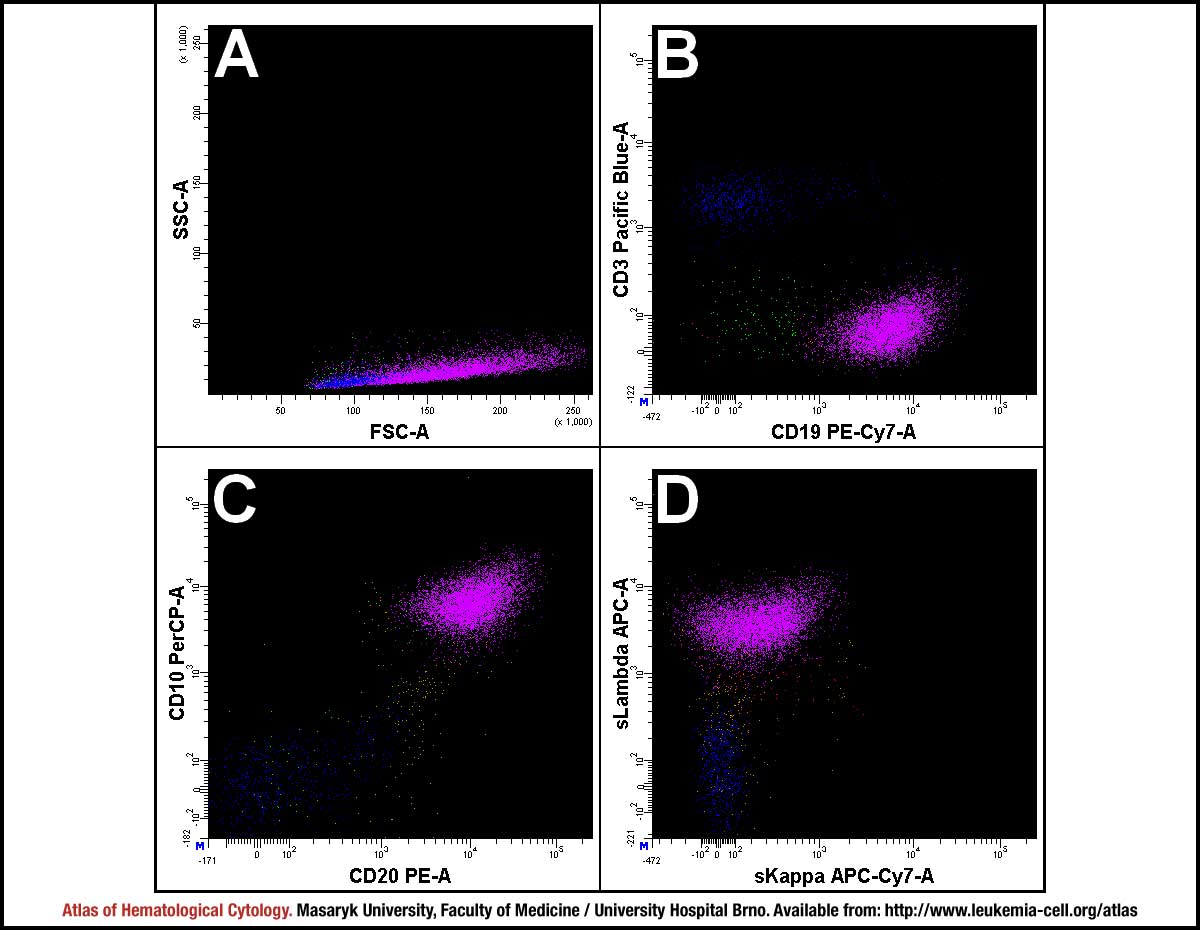
The analysis of a lymph node shows neoplastic B lymphocytes (purple), T lymphocytes (blue), physiological B lymphocytes (brown) and all lymphocytes (green).
In comparison with normal large T cells, neoplastic B cells show markedly increased values of forward scatter (A). Neoplastic B cells express CD19, CD20 and CD10 (B, C); in this image, a monotypic population of neoplastic B cells is characterised by expression of the light chain sLambda (D).
Atlas of Haematological Cytology [online]. 2016 [cit. 2024-4-24]. Available from WWW: http://www.leukemia-cell.org/atlas.
2024 CELL - Atlas of Haematological Cytology | site map
 zoom picture