with flowcytometry, cytogenetic and molecular biology findings
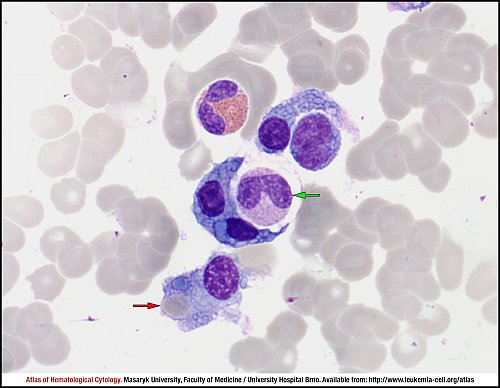
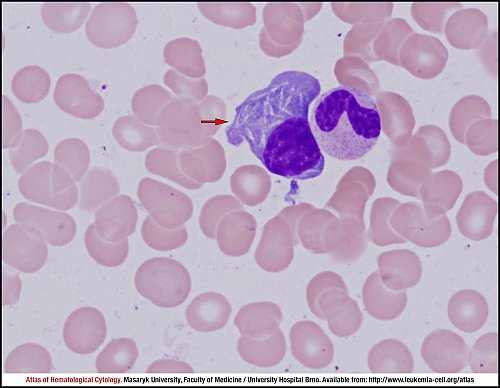
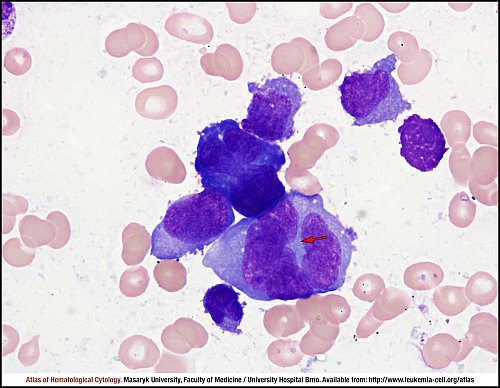
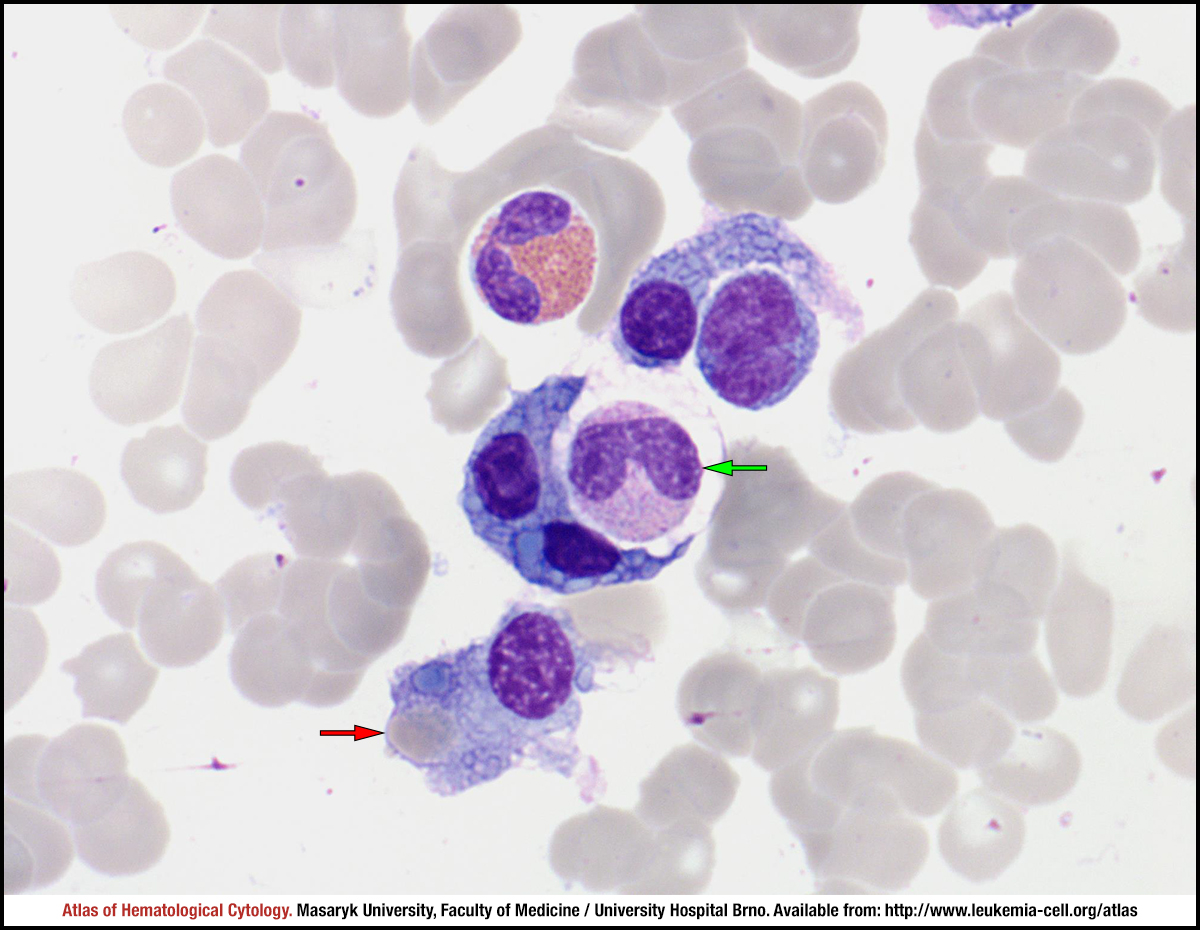
Ingestion of haemopoietic cells can be found in some cases of plasma cell leukaemia or plasma cell myeloma. A band neutrophil was ingested by a binuclear myeloma cell (green arrow), whereas another tumour cell contains an ingested erythrocyte (red arrow).
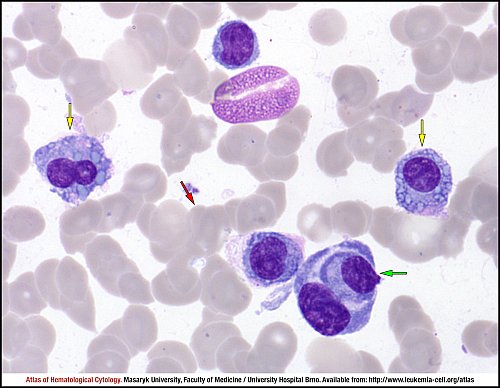
A tumour cell can also ingest another tumour cell (green arrow). Pathological plasma cells contain numerous Russell bodies in their cytoplasm (yellow arrows). The “rouleaux” formation of erythrocytes is evident in the smear (red arrow).
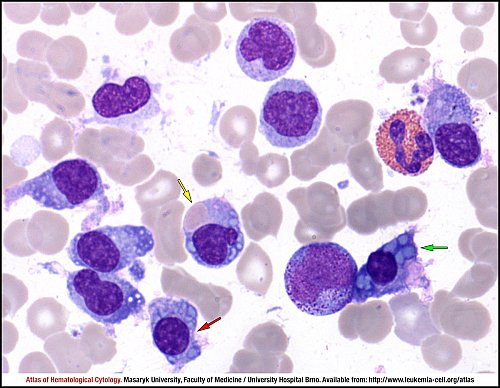
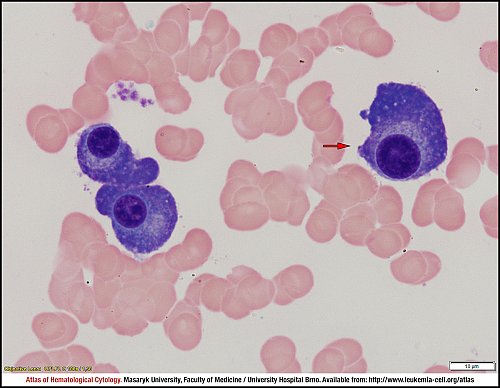
Numerous Russell bodies can be found in some tumour cells (green arrow, red arrow); when Russell bodies or apparent vacuoles almost fill up the cytoplasm content, the cell is referred to as the “Mott cell” (red arrow). A Russell body must be distinguished from an ingested erythrocyte (yellow arrow).
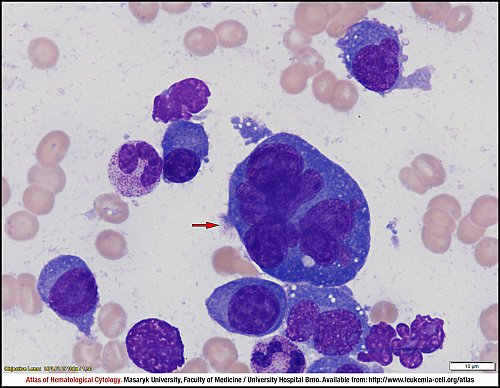
Myeloma plasma cells and a multinucleated cell (red arrow). Note the prominent anisocytosis, marked basophilia and minute vacuoles in the cytoplasm of the cells.
Small pathological plasma cells with basophilic villous cytoplasm and off-centre located nuclei.
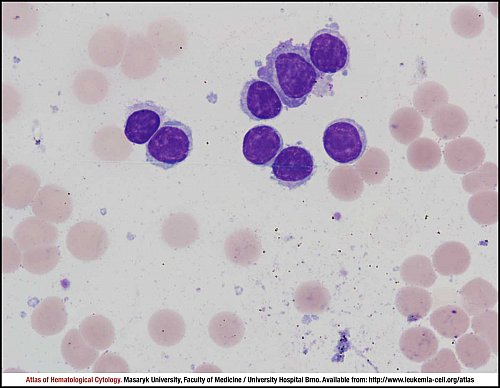
Basophilic plasma cells and one plasma cell with a double nucleus (red arrow). Note the deeply basophilic cytoplasm without perinuclear halo.
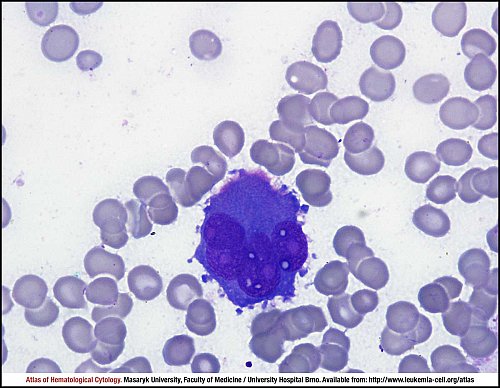
A medium-sized plasma cell (red arrow) with needle-shaped cytoplasmic inclusions.
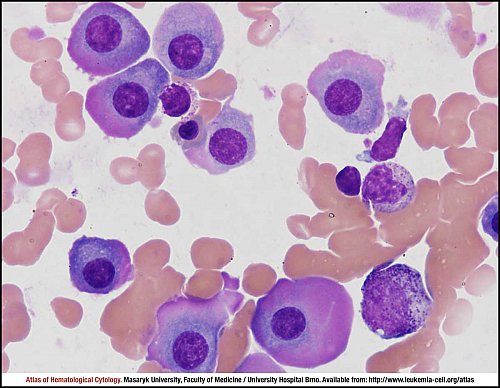
Marshall cells with a prominent perinuclear halo, eccentrically located nuclei without nucleoli and a relatively dense structure of nuclei. Note the marked rouleaux formation of erythrocytes, which is caused by the presence of paraprotein.
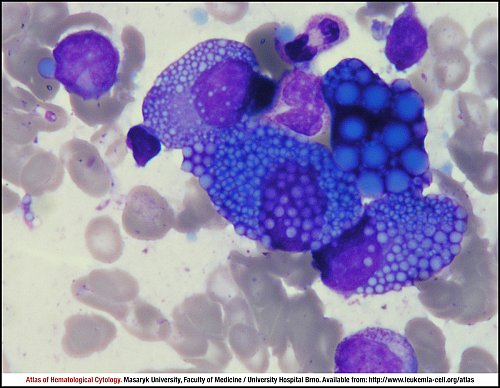
Mott cells: the cytoplasm of these bizarre plasma cells is packed with Russel bodies of a variable size.
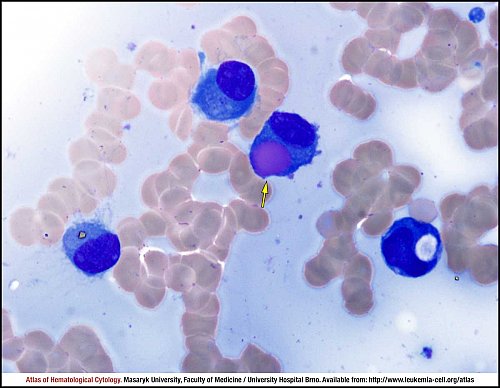
One plasma cell with a huge cytoplasmic inclusion – the Russel body – in the cytoplasm (yellow arrow). The pinkish colour of the inclusion is caused by IgA paraprotein.
This image shows lymphoplasmacytoid cells, i.e. lymphoid elements with features of plasma cells (e.g. rich in basophilic cytoplasm).
Pleomorphic myeloma plasma cells of “monocytoid” type with a fine structure of nuclei and rare nucleoli. Note the giant multi-nucleated element (red arrow).
Giant myeloma plasma cells containing large nuclei with fine chromatin and visible nucleoli. The characteristic perinuclear halo is lacking.
Large multinucleated myeloma plasma cell featuring fine nuclear chromatin and prominent nucleoli. The cytoplasm is deeply basophilic with fine inclusions.
Myeloma plasma cells with prominent anisocytosis and relatively small nuclei. Note the marginal carminophilia of cytoplasm, which is rather marked in this case.
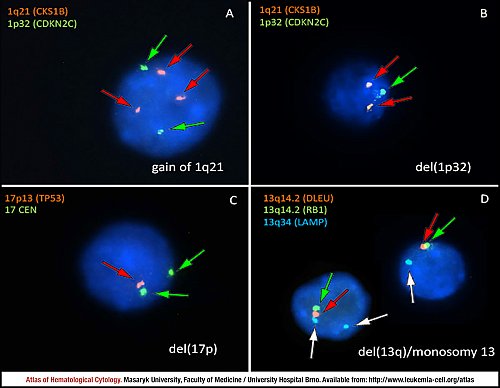
The current widely accepted model of plasma cell myeloma oncogenesis describes two different pathways. The first one is represented by hyperdiploidy, which is observed in up to 55% of patients, whereas the second one is based on IGH translocations, which are observed in approximately 40% to 50% of patients. Hyperdiploidy is characterised by trisomies of certain odd-numbered chromosomes, namely, 3, 5, 7, 9, 11, 15, 19, and 21. Non-hyperdiploidy plasma cell myeloma involves translocations of immunoglobulin heavy chain locus (IGH) at chromosome 14q32 with various partner chromosomes as chromosomes 4, 6, 11, 16, and 20. Besides these supposedly primary events, many other chromosomal rearrangements are present in tumour plasma cells at the time of diagnosis. The most frequent ones involve monosomy 13 (45%), duplication of the long arm of chromosome 1 (1q gains, 30% to 35%) and various deletions, involving mainly chromosomal regions 1p and 17p.
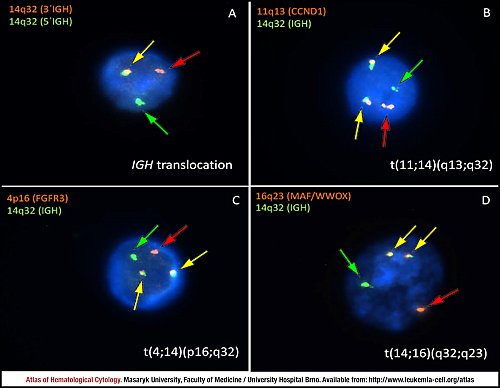
Translocations involving the immunoglobulin heavy chain locus (IGH) at chromosome 14q32 are observed in approximately 40% to 50% of all cases of plasma cell myeloma. The most important partner chromosomes are chromosomes 4, 6, 11, 16, and 20.
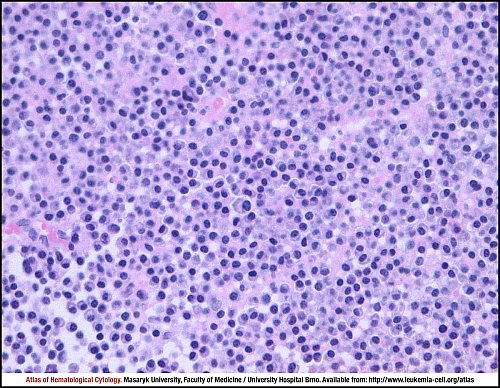
Plasma cell myeloma. Diffuse infiltration of bone marrow. The tumour is composed of mature-appearing (“Marschalkó-type”) plasma cells with a low nuclear-cytoplasmic ratio, eccentric nuclei with clumped chromatin, and perinuclear pale Golgi zone in the cytoplasm. There is no mitotic activity: in this case, the proliferation index measured by Ki67 was below 1%.
Osteolytic lesion of vertebra, biopsy, haematoxylin and eosin stain.
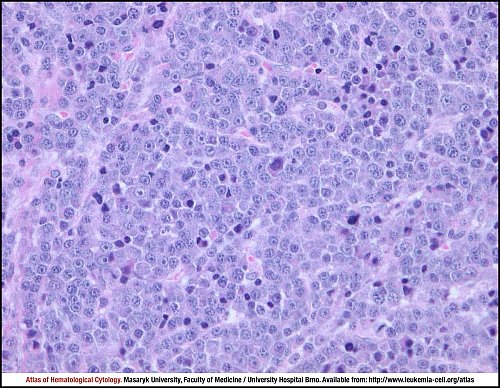
Plasma cell myeloma. Diffuse infiltration of bone marrow. This tumour is composed of immature plasma cells with a slightly increased nuclear-cytoplasmic ratio, nuclear-cytoplasmic asynchrony and conspicuous nucleoli. In this case, the proliferation index measured by Ki67 was more than 35%.
Osteolytic lesion of vertebra, biopsy, haematoxylin and eosin stain.
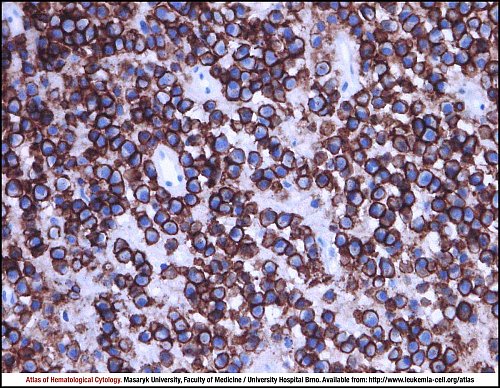
Plasma cell myeloma. Tumour cells show strong membrane positivity for CD138 (syndecan-1).
Osteolytic lesion of vertebra, biopsy, immunohistochemistry.
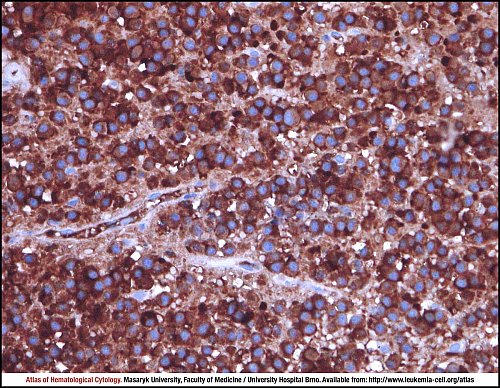
Plasma cell myeloma. Tumour cells show strong cytoplasmic positivity for kappa immunoglobulin light chains. The lambda light chains were completely negative.
Osteolytic lesion of vertebra, biopsy, immunohistochemistry.
Atlas of Haematological Cytology [online]. 2016 [cit. 2025-7-04]. Available from WWW: http://www.leukemia-cell.org/atlas.
2025 CELL - Atlas of Haematological Cytology | site map
 zoom picture
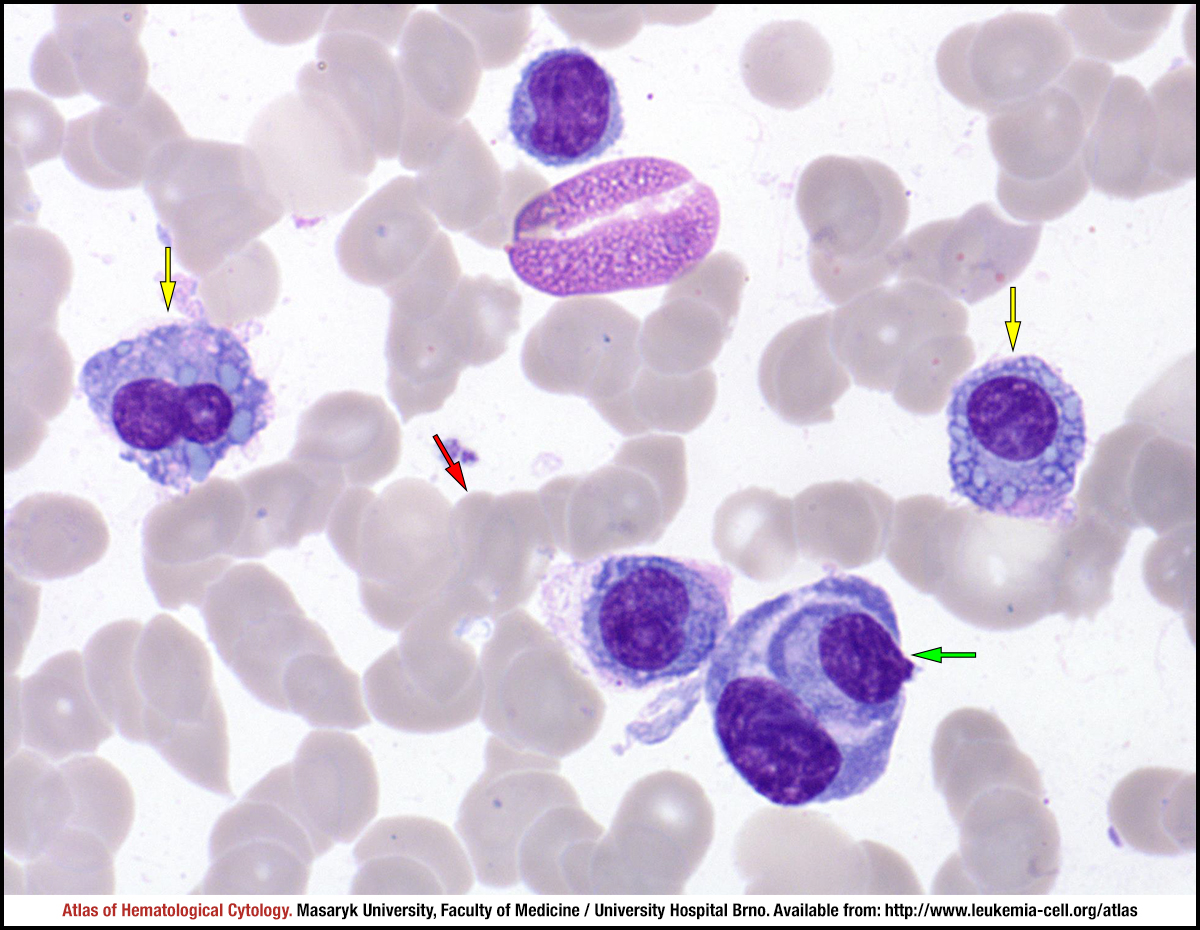 zoom picture
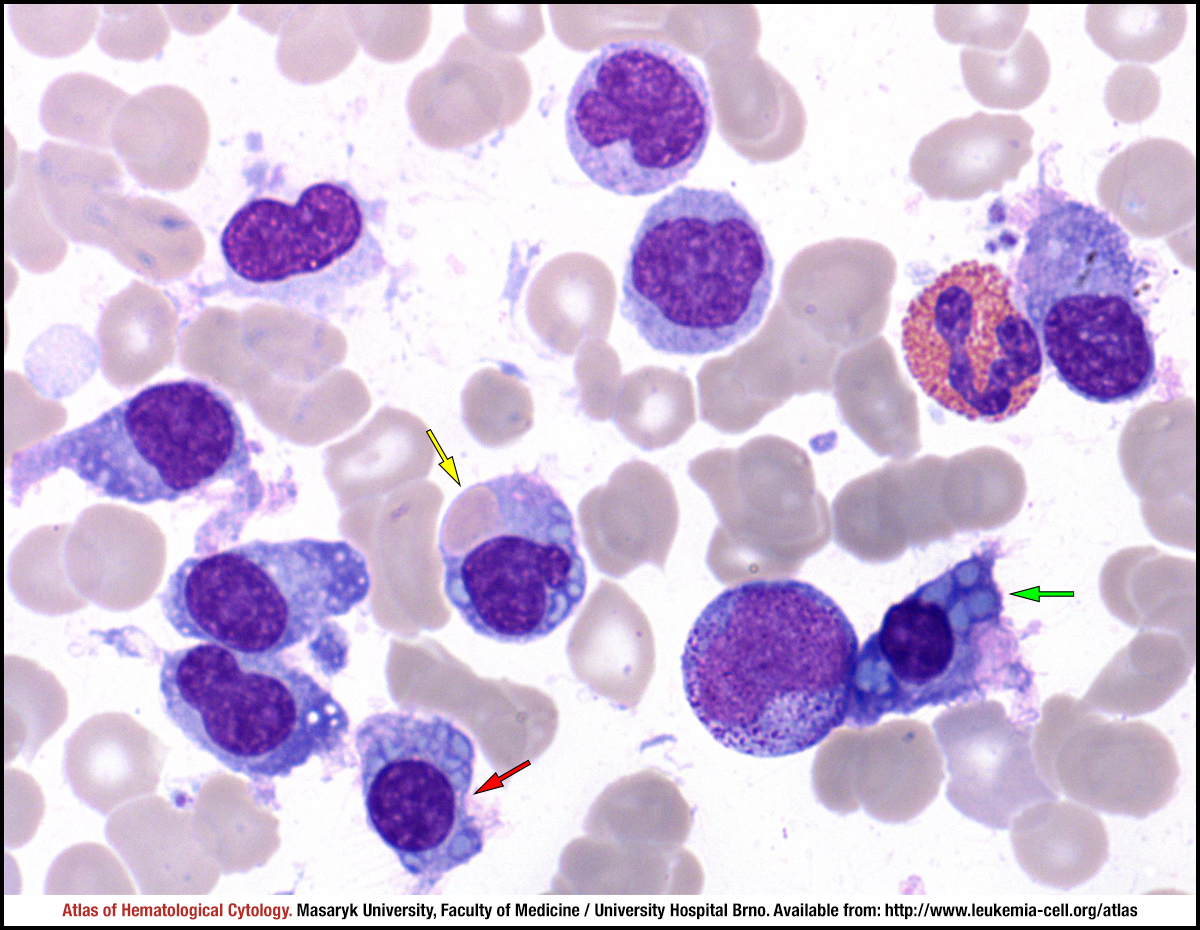 zoom picture
 zoom picture
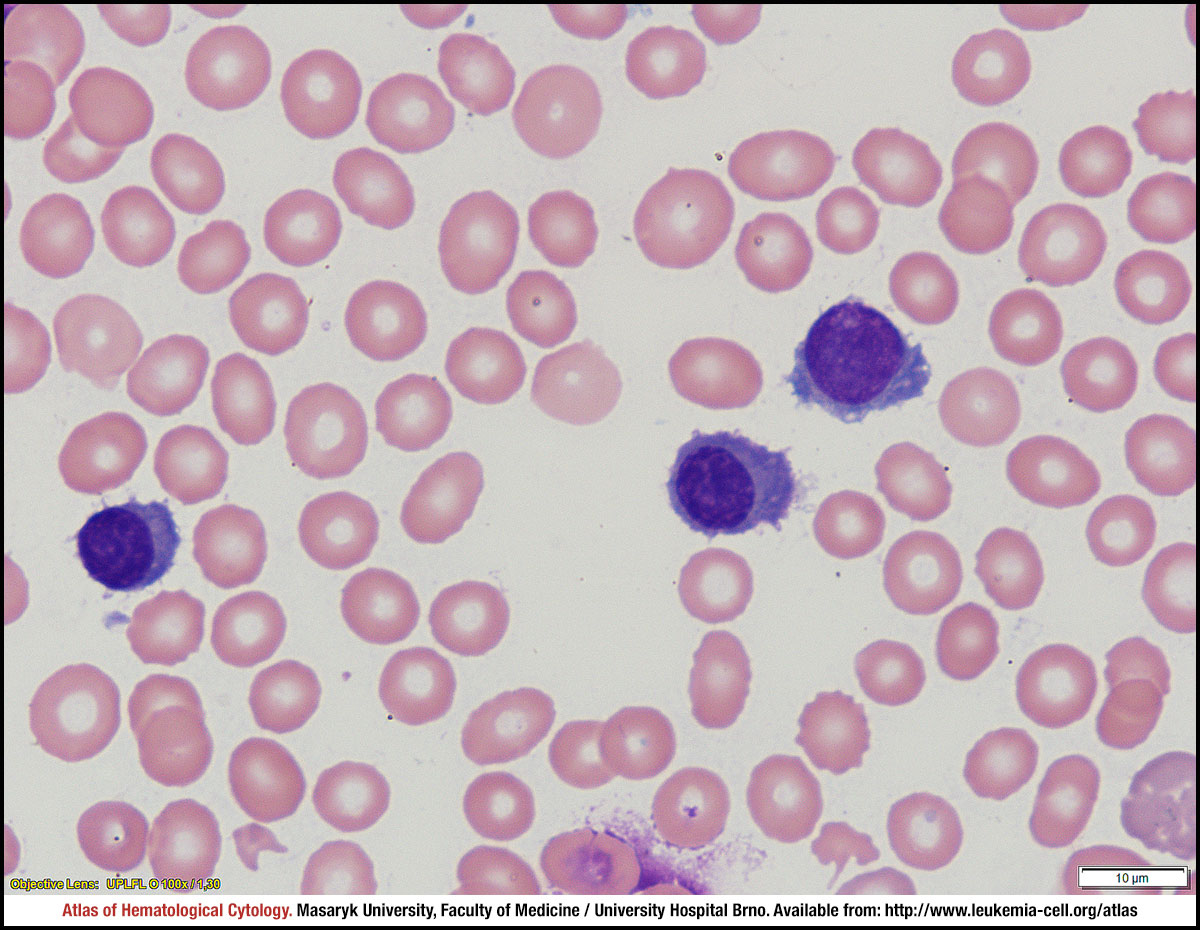 zoom picture
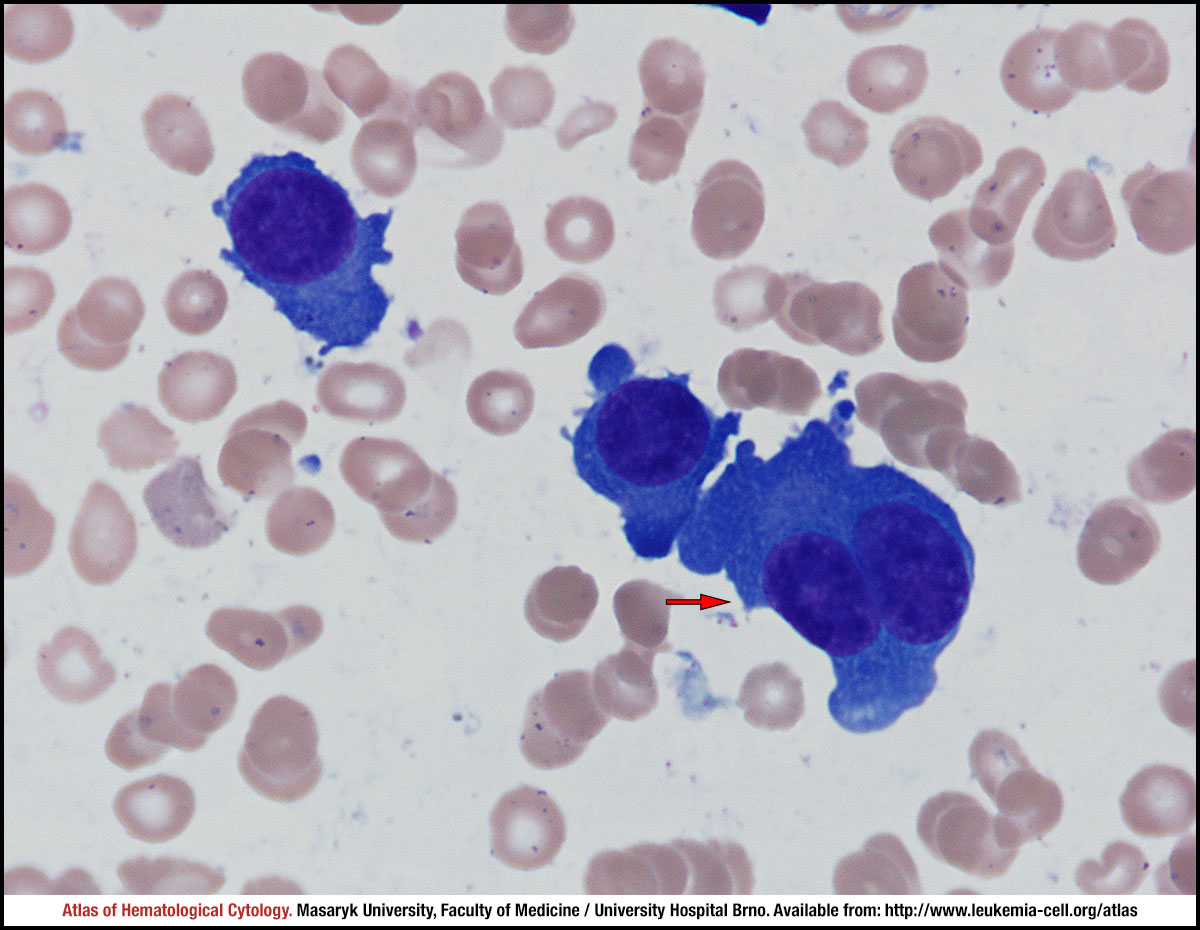 zoom picture
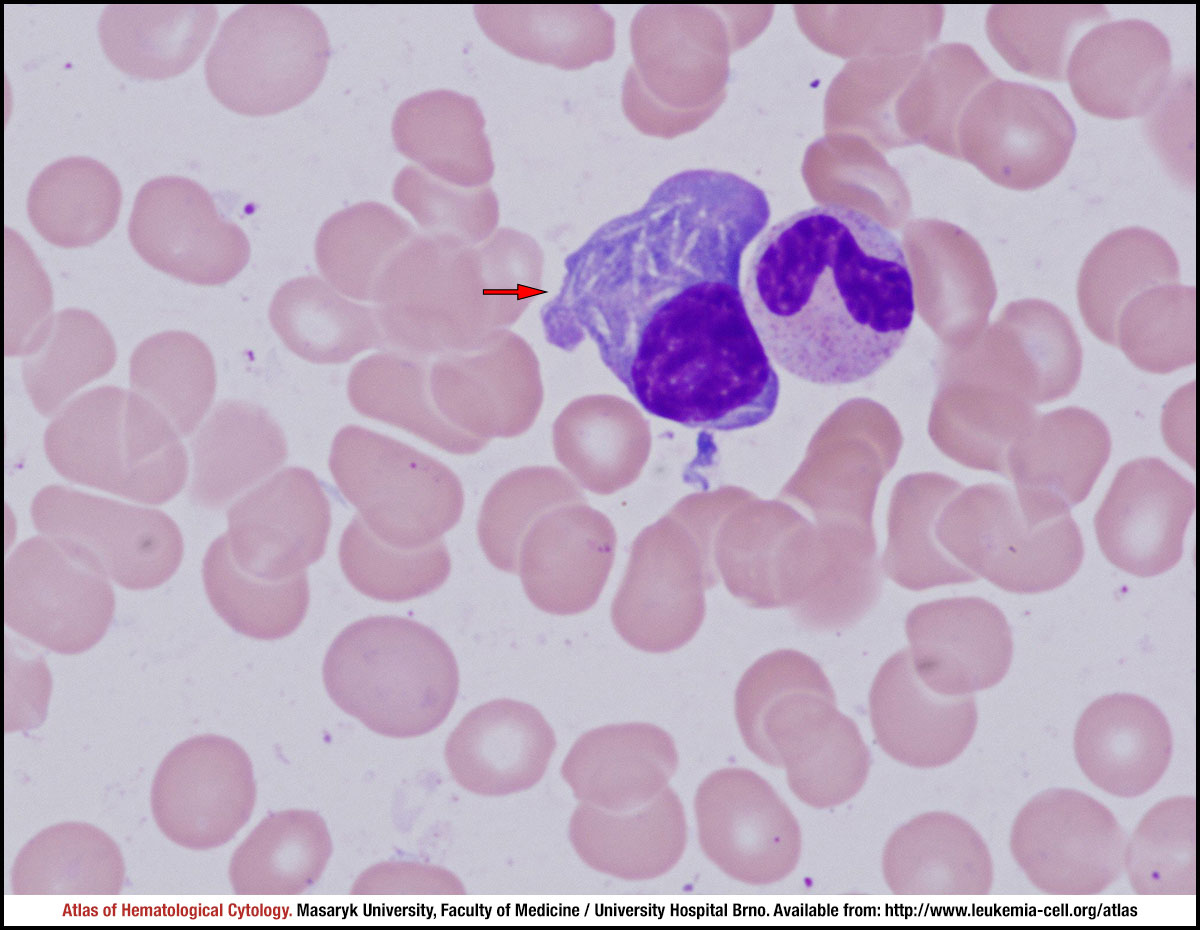 zoom picture
 zoom picture
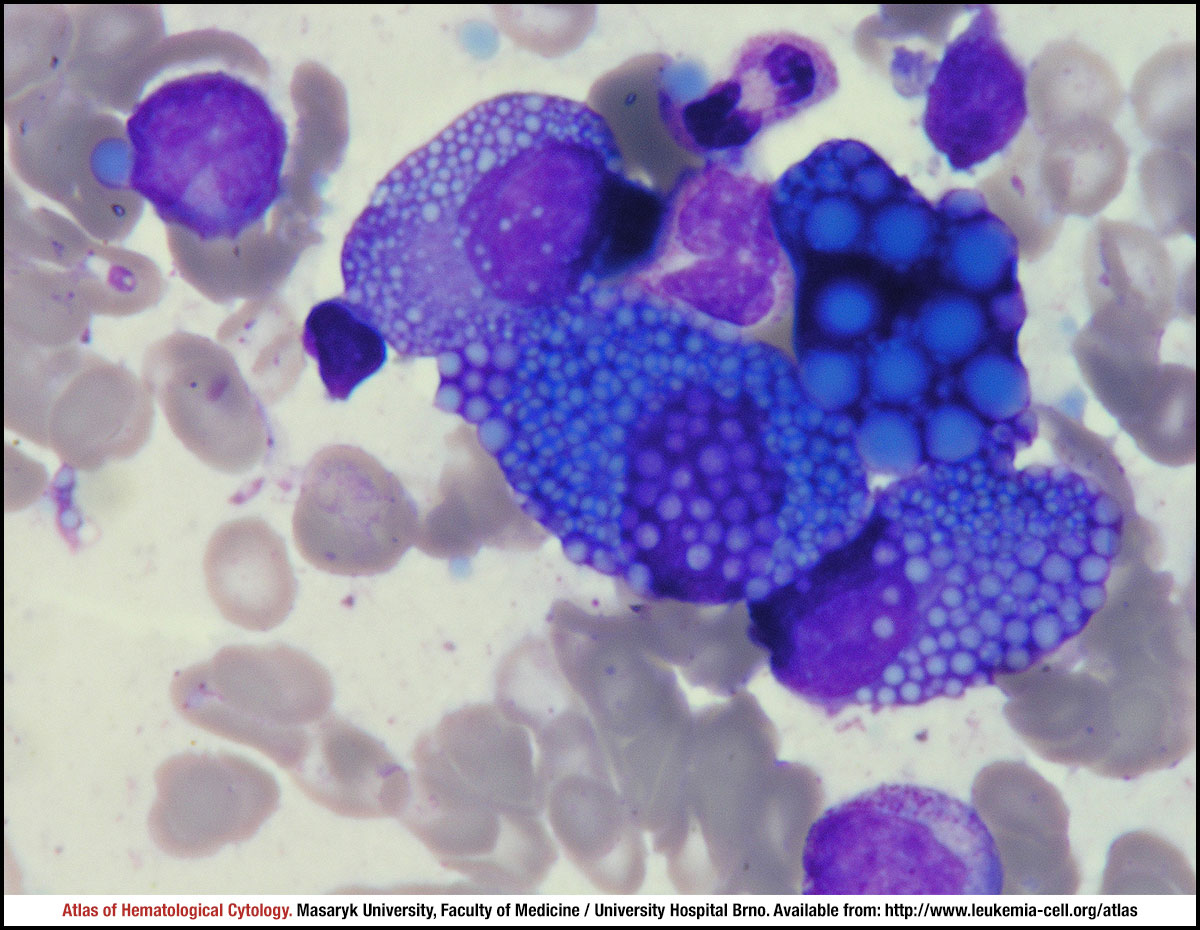 zoom picture
 zoom picture
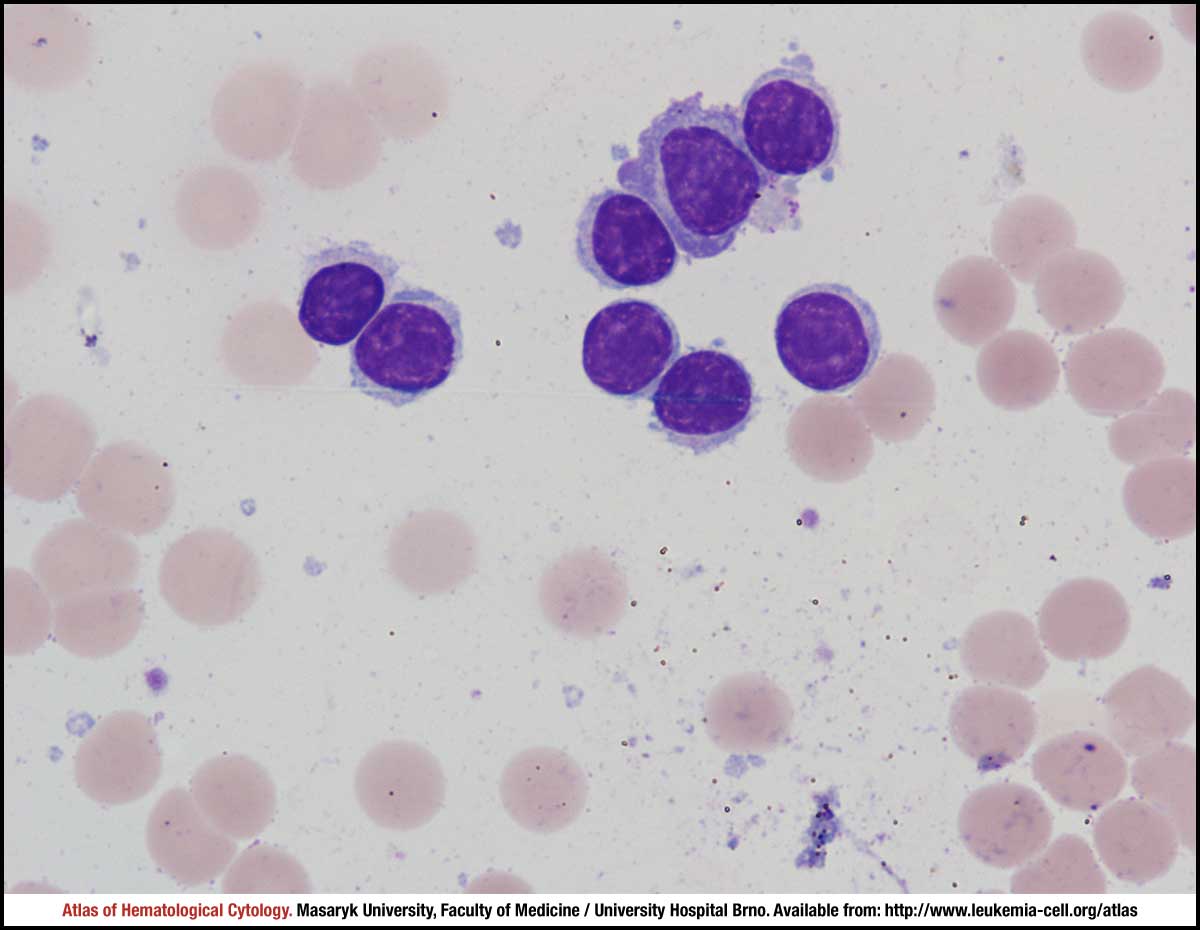 zoom picture
 zoom picture
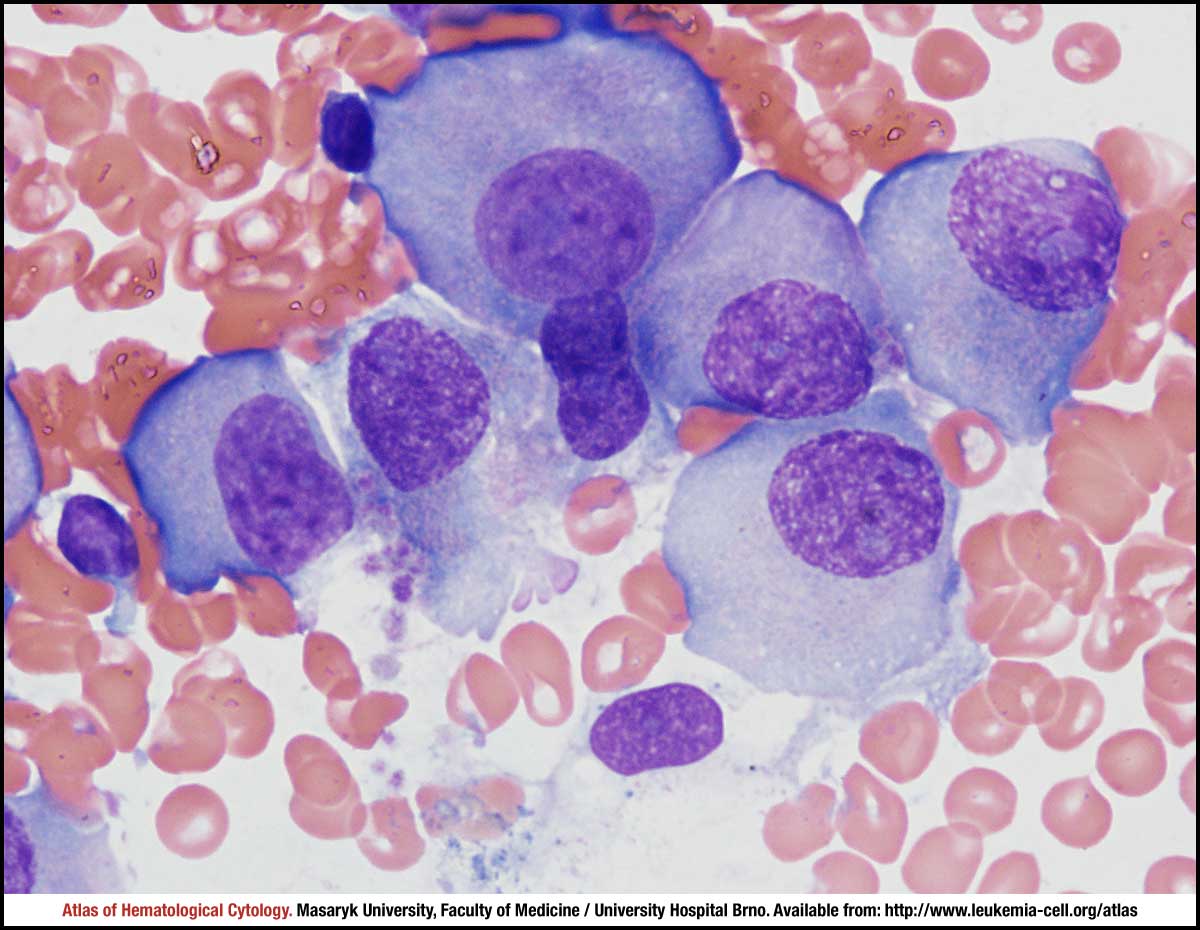 zoom picture
 zoom picture
 zoom picture
 zoom picture
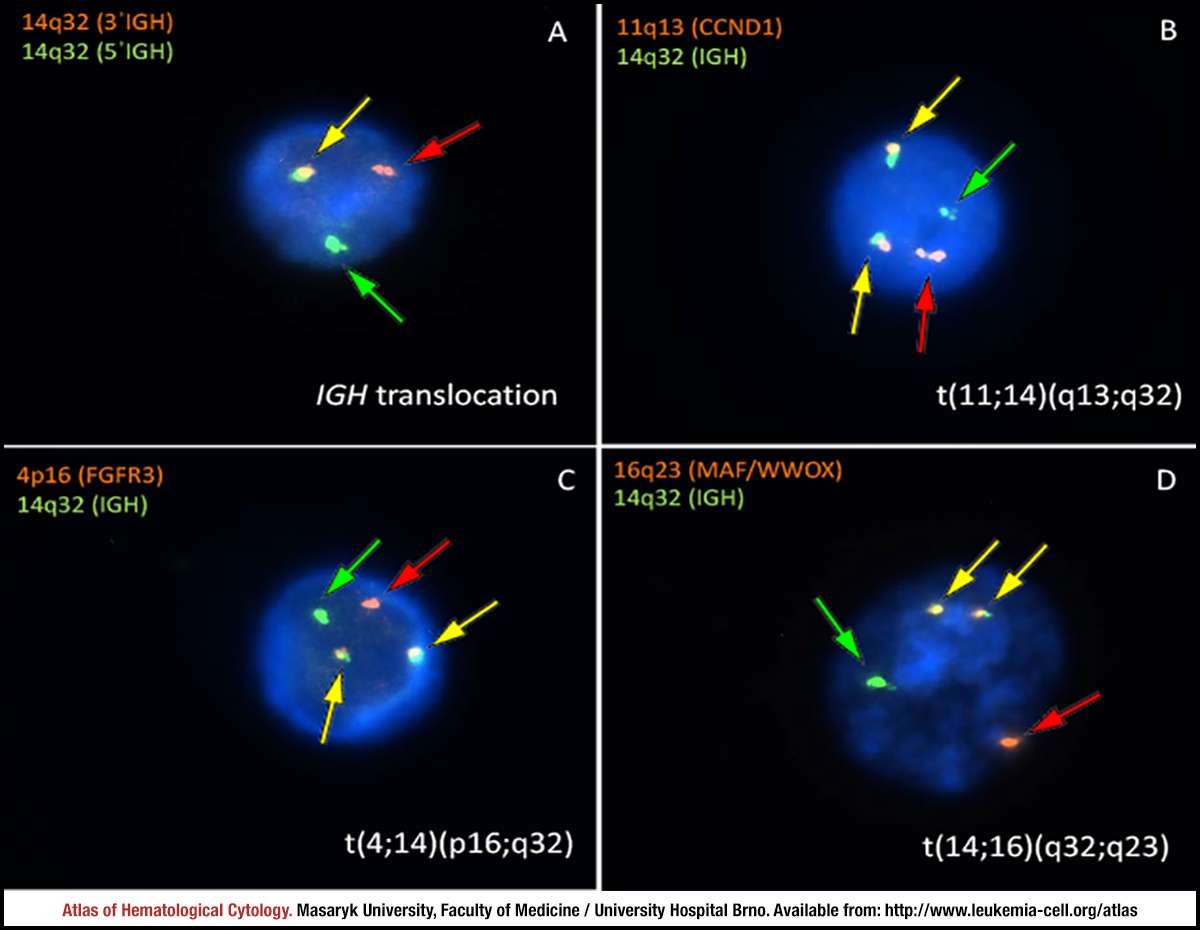 zoom picture
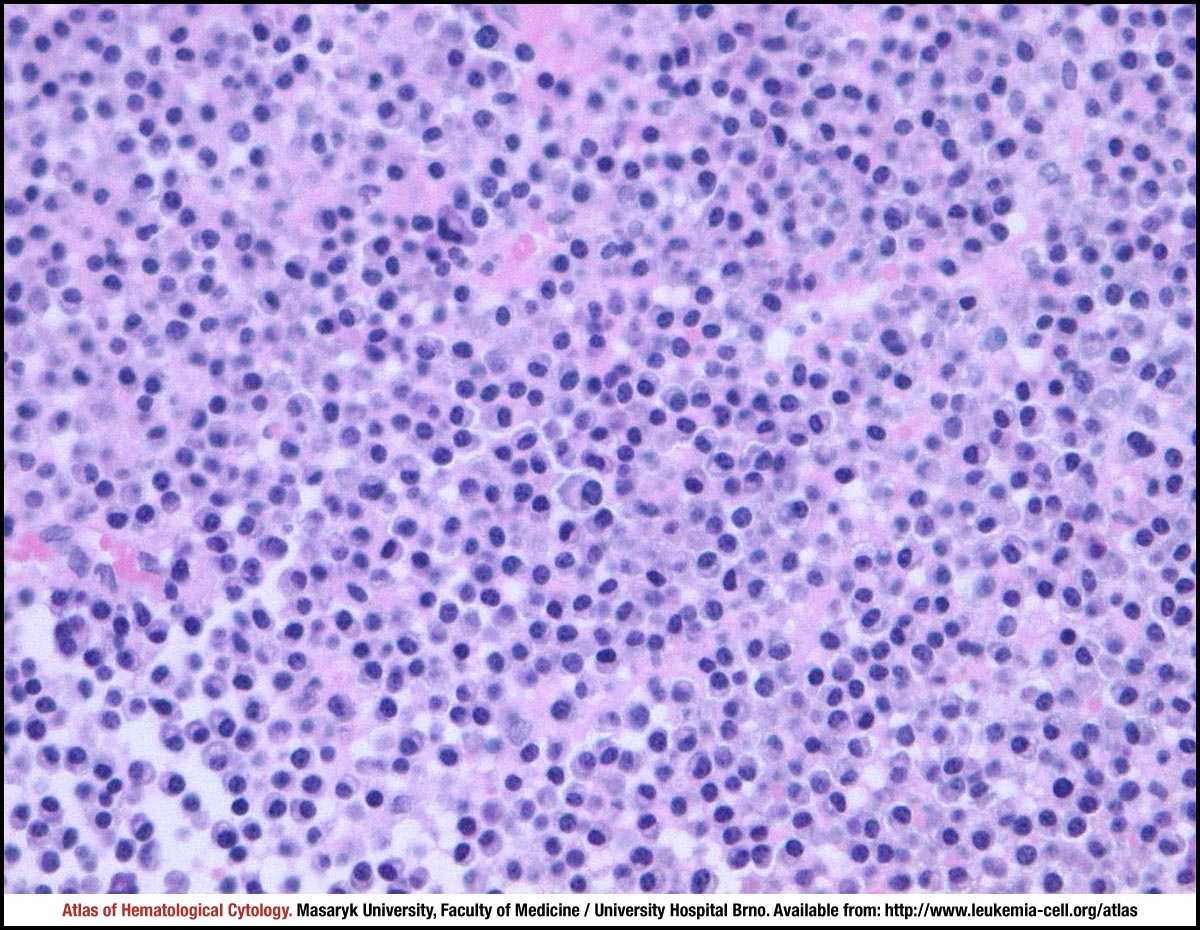 zoom picture
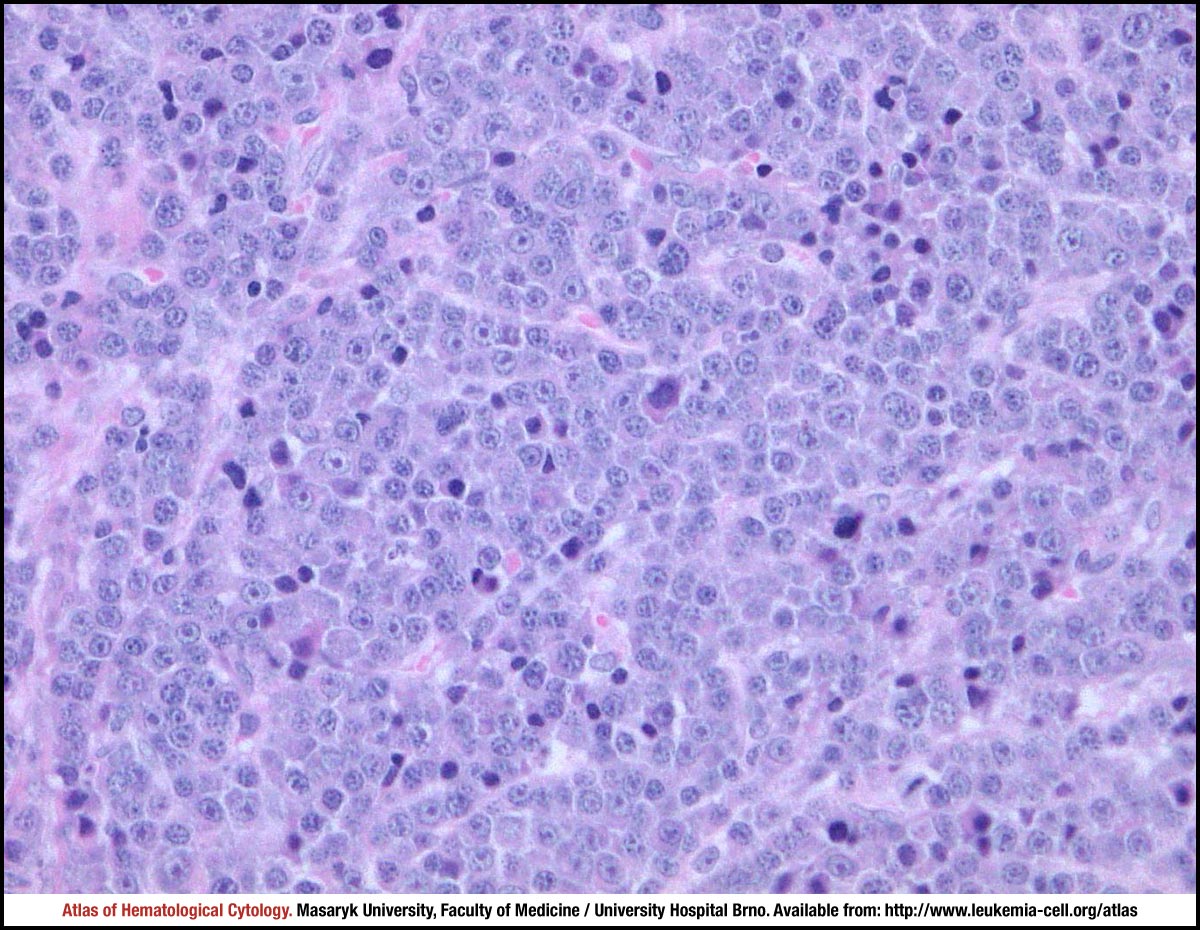 zoom picture
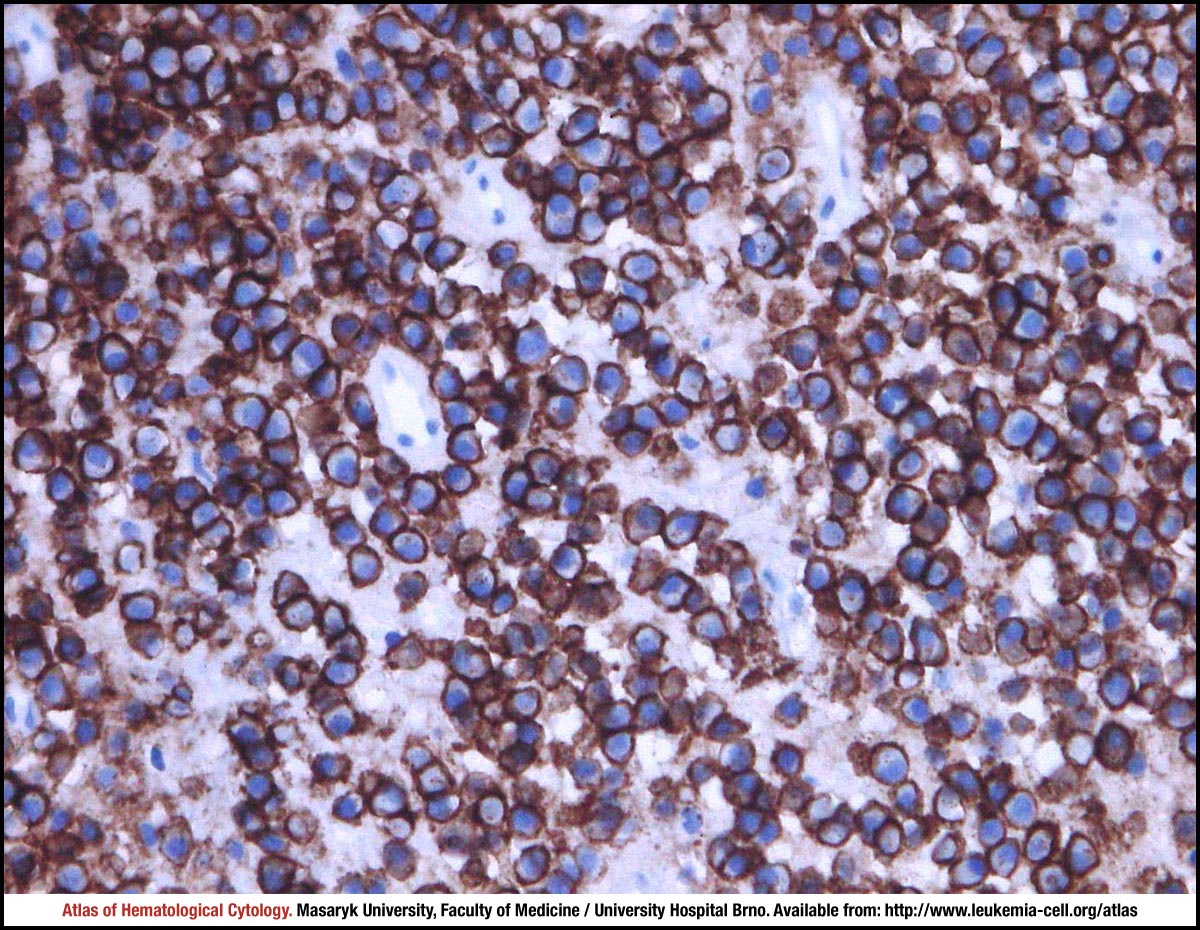 zoom picture
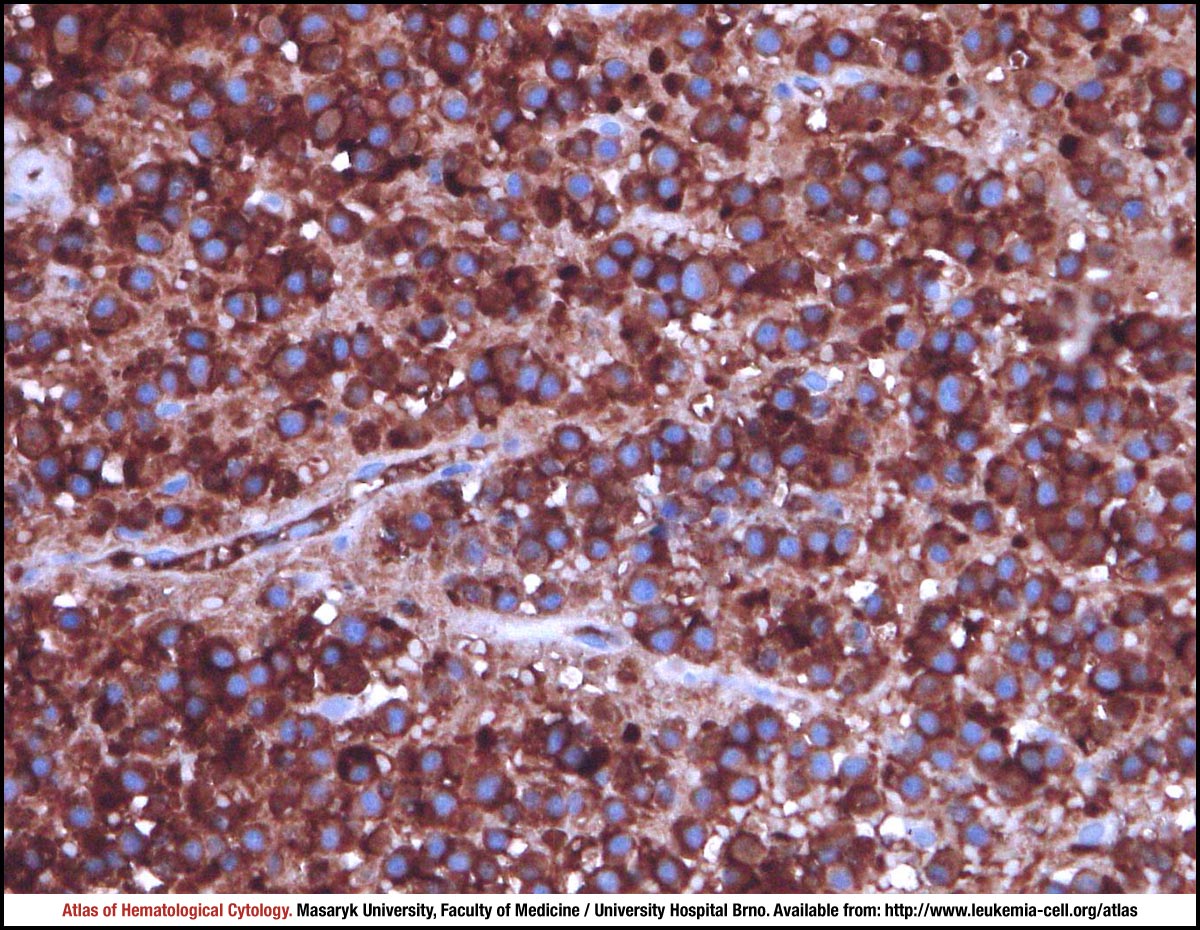 zoom picture