with flowcytometry, cytogenetic and molecular biology findings
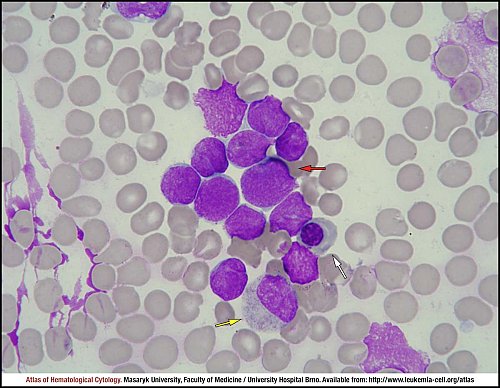
Several medium-sized blasts with a high nuclear-cytoplasmic ratio. The nuclei range from round to irregular with condensed nuclear chromatin and no evident nucleoli; there is a small amount of medium basophilic cytoplasm (red arrow). A neutrophilic myelocyte (yellow arrow) and an erythroid precursor (white arrow) are also shown in the image.
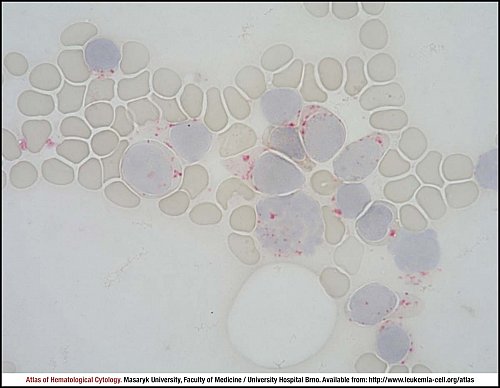
Lymphoblasts are MPO-negative, whereas a neutrophilic myelocyte (yellow arrow) is MPO-positive.
A focal or paranuclear pattern of acid phosphatase positivity is typical of T-lineage ALL.
Analysis of a bone marrow sample – colour marking of individual populations: leukaemic T blasts (purple), T lymphocytes (blue), all lymphocytes (green), monocytes (yellow) and granulocytes (red).
Leukaemic T blasts are characterised by a low value of side scatter (SSC) and a low expression of CD45 (A), as well as by positivity for CD5, CD7, cytoplasmic CD3 and cytoplasmic TdT; moreover, they display negativity for CD2, surface CD3, TCR and a hyperexpression of CD99 (B–F).
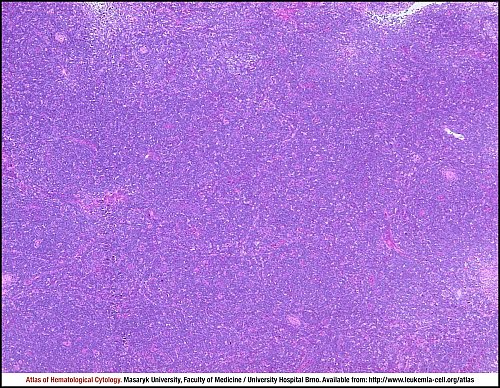
T-lymphoblastic lymphoma. The structure of lymph node is effaced by the diffuse lymphoma infiltrate.
Lymph node biopsy, haematoxylin and eosin stain.
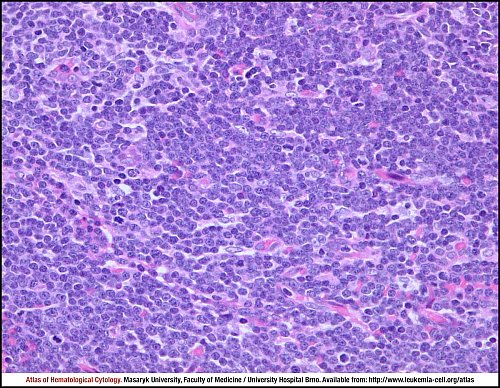
T-lymphoblastic lymphoma. The lymphoma is composed of uniform medium-sized immature cells.
Lymph node biopsy, haematoxylin and eosin stain.
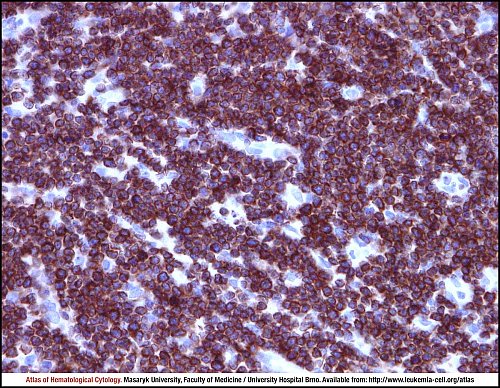
T-lymphoblastic lymphoma. Tumour cells show strong cytoplasmic and membranous positivity for CD3.
Lymph node biopsy, immunohistochemistry.
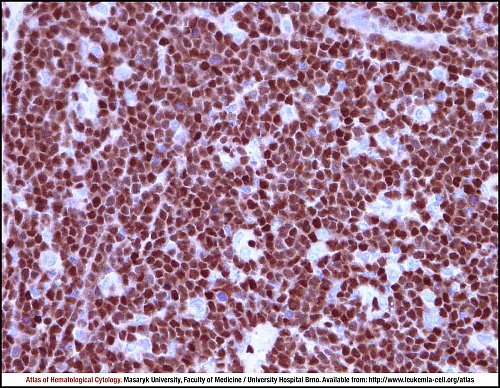
T-lymphoblastic lymphoma. Tumour cells show strong nuclear positivity for TdT.
Lymph node biopsy, immunohistochemistry.
Atlas of Haematological Cytology [online]. 2016 [cit. 2024-4-20]. Available from WWW: http://www.leukemia-cell.org/atlas.
2024 CELL - Atlas of Haematological Cytology | site map
 zoom picture
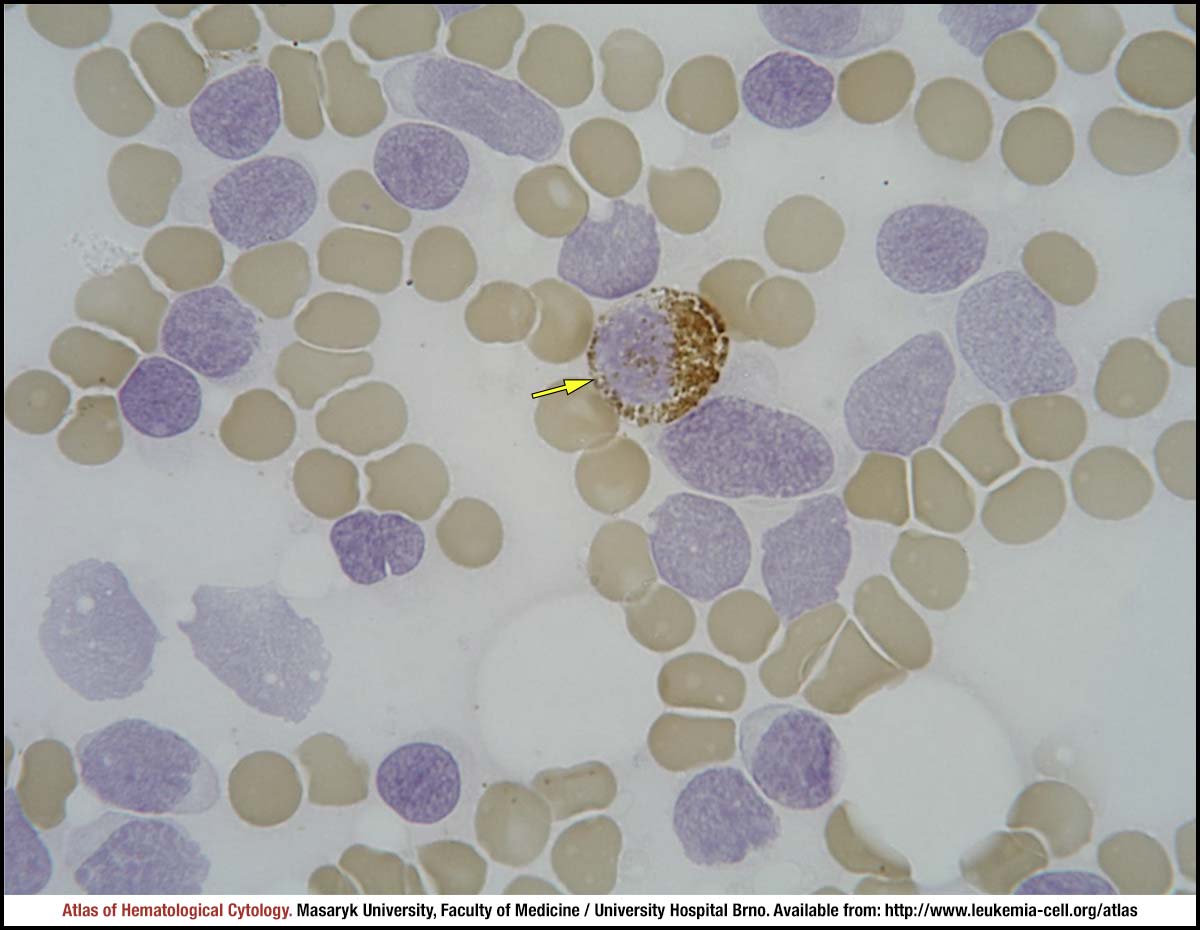 zoom picture
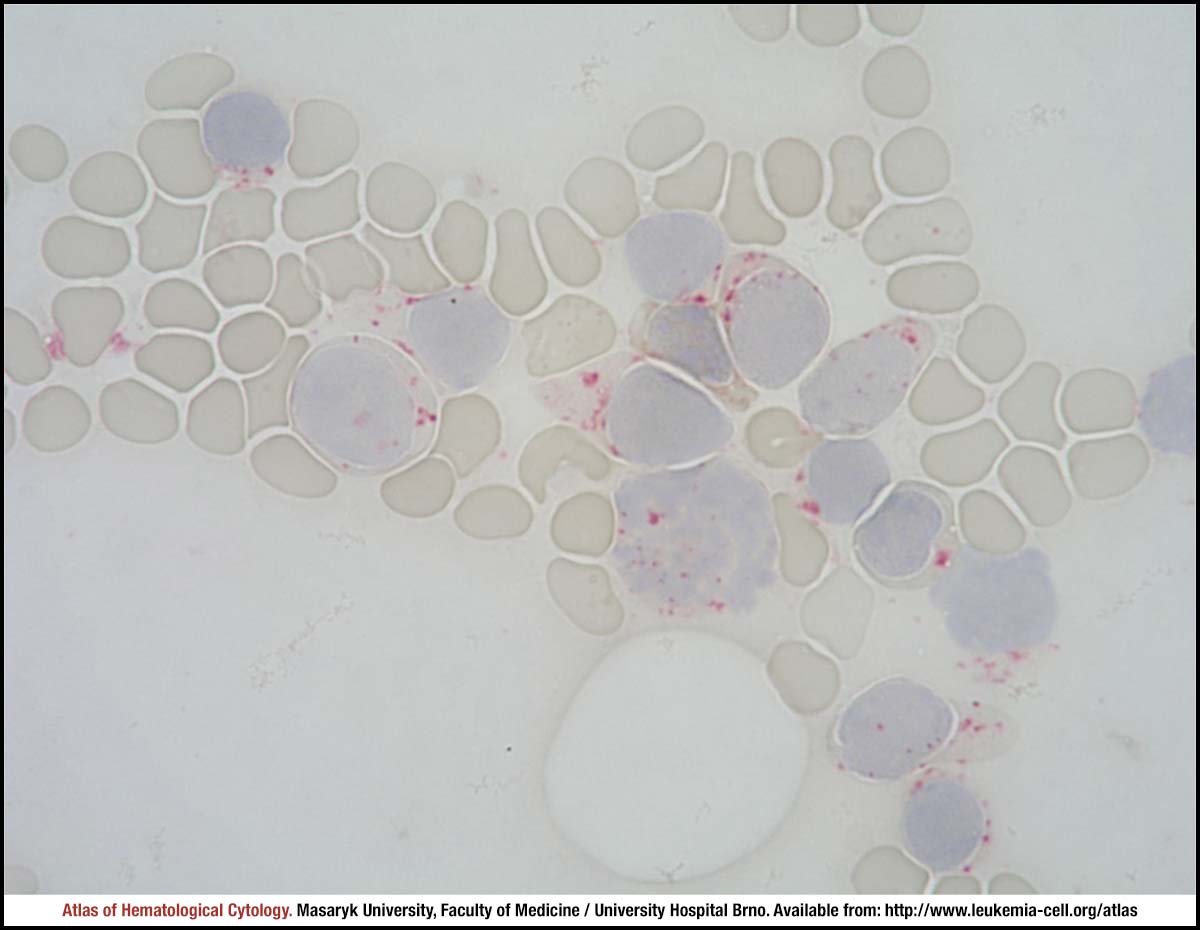 zoom picture
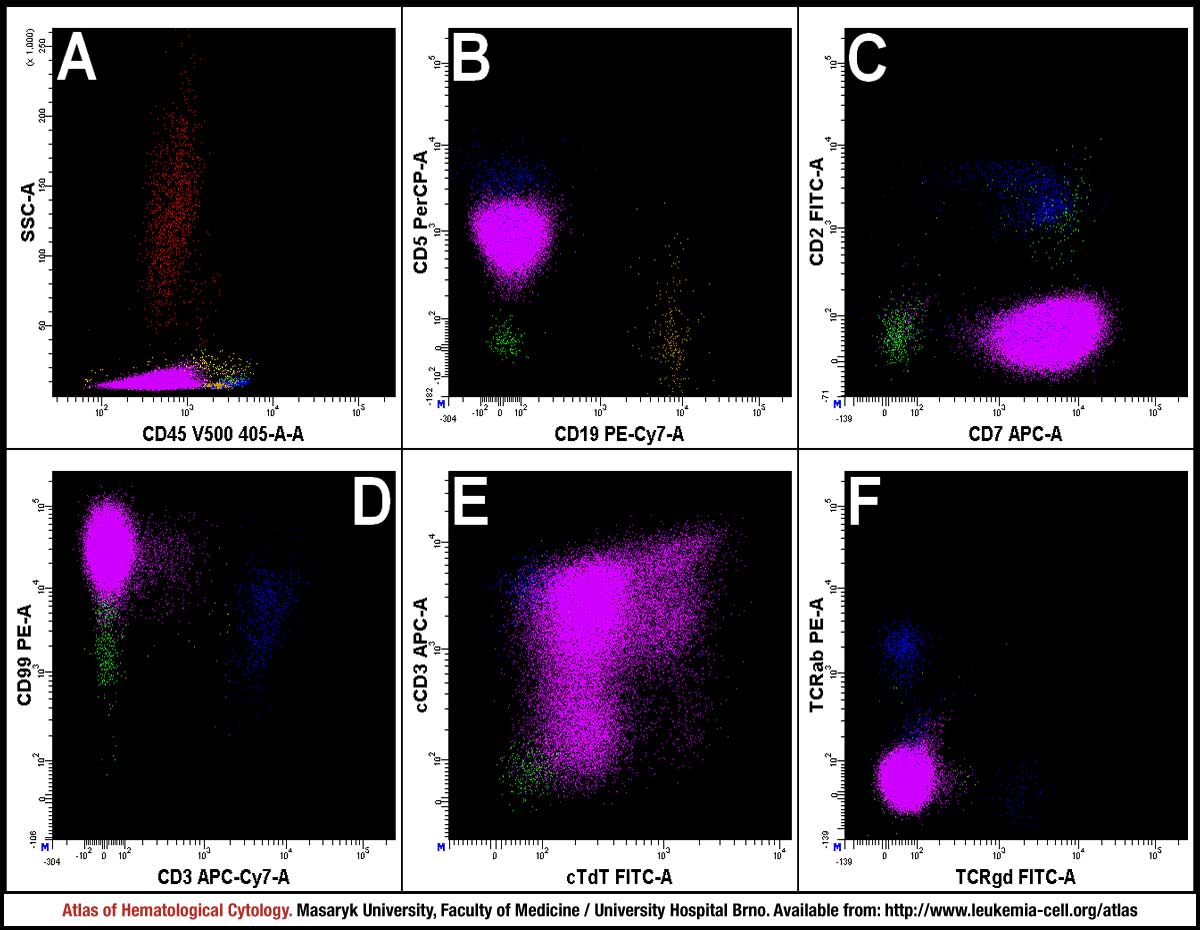 zoom picture
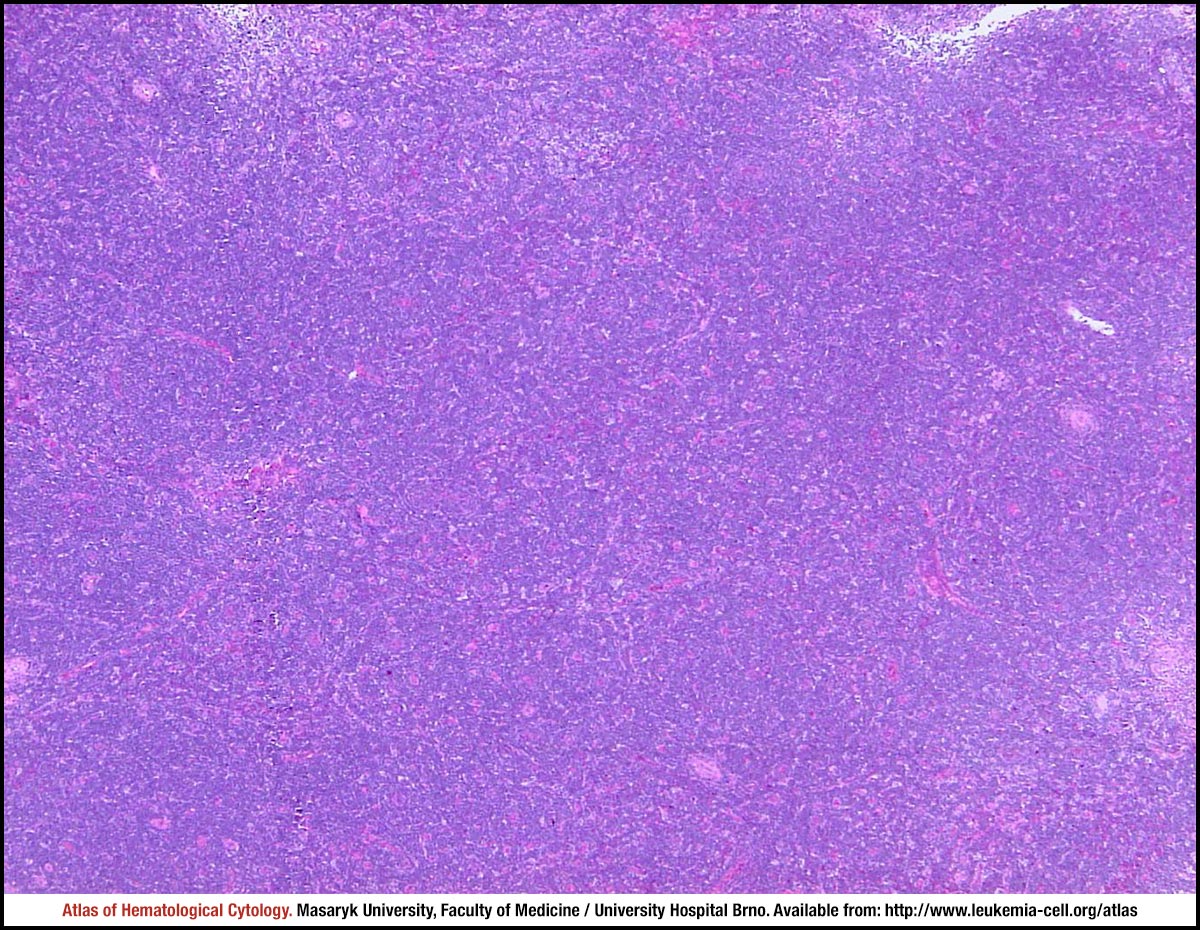 zoom picture
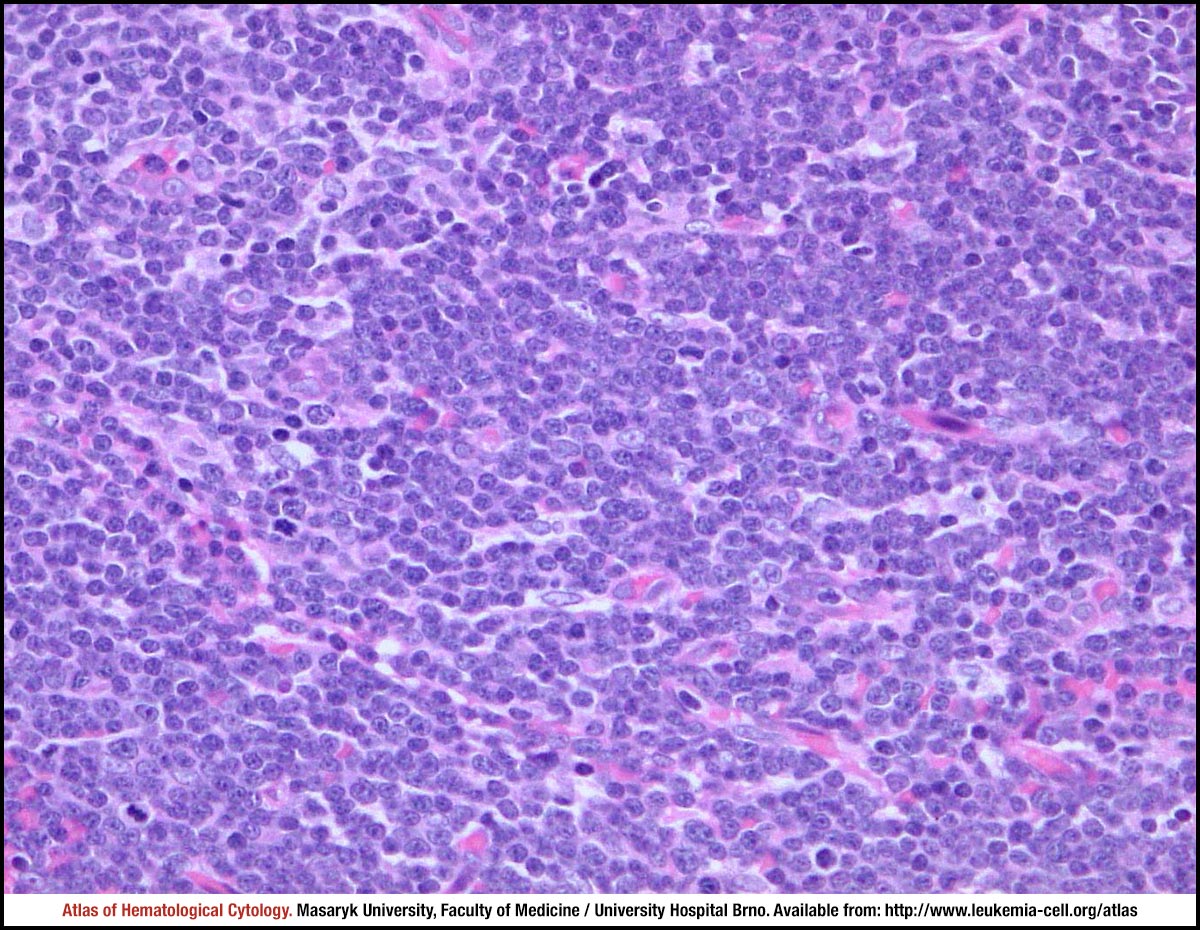 zoom picture
 zoom picture
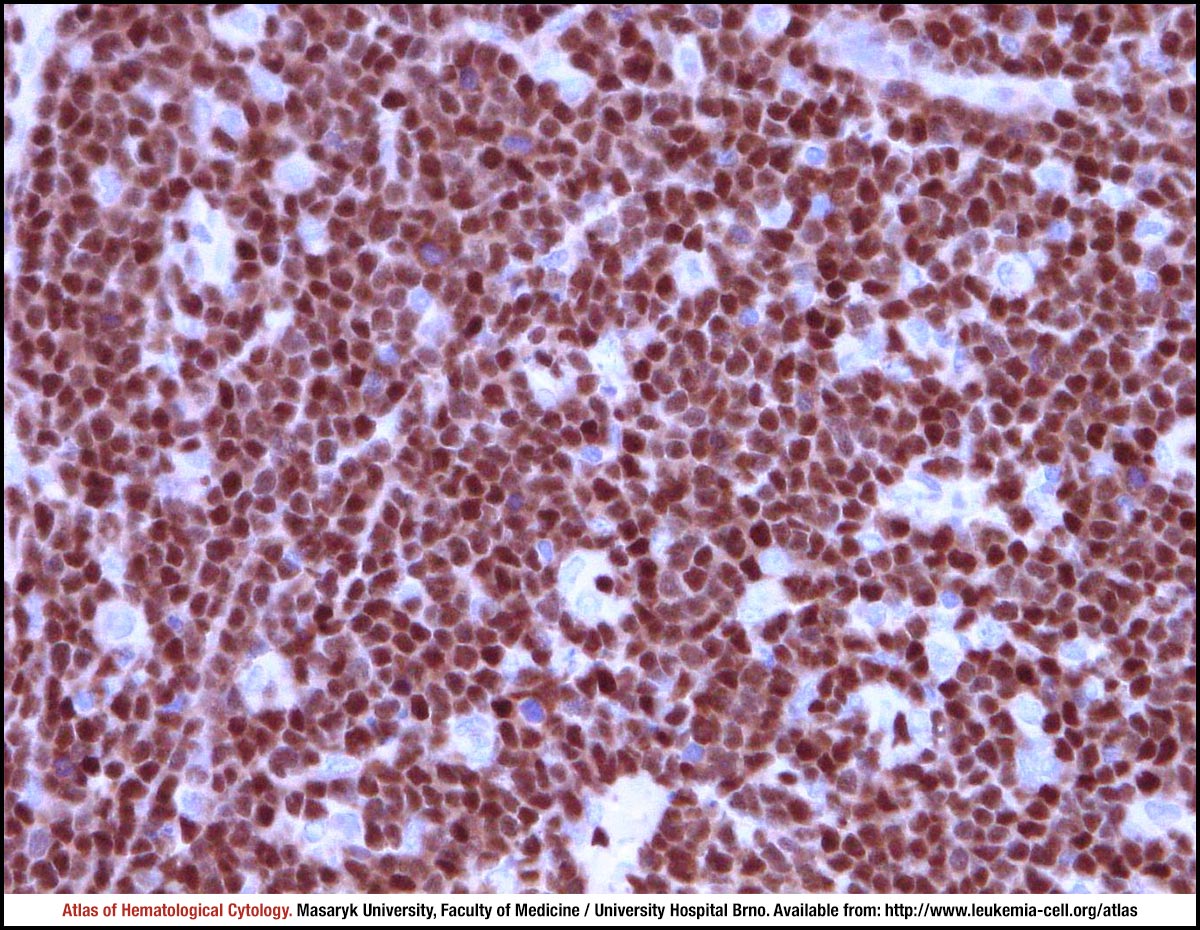 zoom picture