with flowcytometry, cytogenetic and molecular biology findings
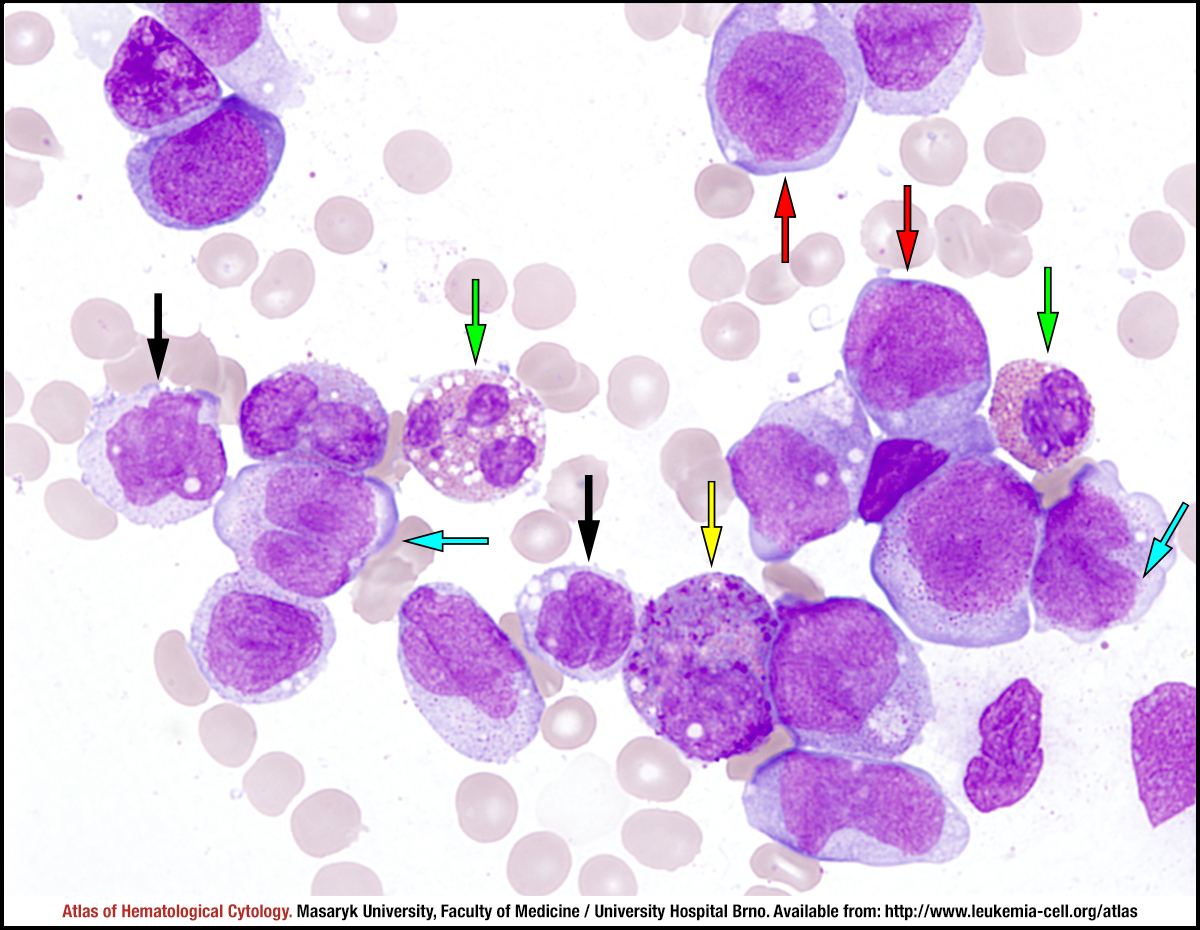
This bone marrow sample shows a picture of myelomonocytic leukaemia; it means that tumour cells are myeloblasts (red arrows), promonocytes with more irregular and often folded nuclei, with fine chromatin and finely granulated cytoplasm (blue arrows) and atypical monocytes (black arrows). The most striking abnormalities involve the presence of a variable number of eosinophils which contain immature eosinophilic granules (yellow arrow). These granules are usually seen only in immature stages; they are not evident in mature eosinophils (red arrows). Moreover, they are larger than those found in normal immature eosinophils.
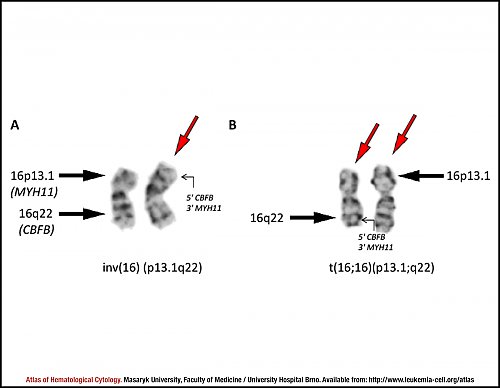
G-banded partial karyotype demonstrating (A) inversion inv(16)(p13.1q22) and (B) translocation t(16;16)(p13.1;q22).
A: The inversion results from breakage and rejoining of bands 16p13.1 and 16q22 on the same chromosome 16. The derivative chromosome 16 is indicated by a red arrow.
B: The translocation t(16;16)(p13.1;q22) results from a breakage at bands 16p13.1 and 16q22 on different chromosomes 16 (the breakpoint sites are indicated by black arrows).
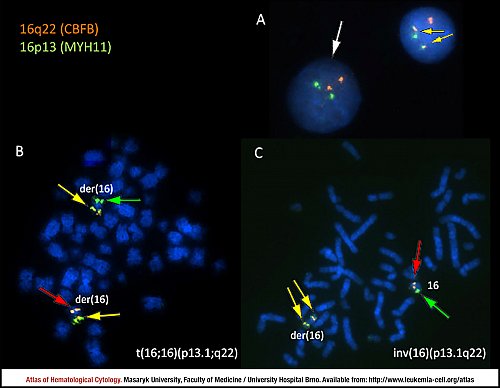
Fluorescence in situ hybridisation (FISH) of CBFB-MYH11 fusion was performed on interphase cells and chromosomes (a dual-colour, dual-fusion FISH probe was used).
A: FISH pattern for inv(16)(p13.1q22) or t(16;16)(p13.1;q22) on an interphase cell: two green-orange fusion signals (indicated by yellow arrows), one green signal for a normal MYH11 locus and one orange signal for a CBFB locus. FISH pattern for normal cells (indicated by a white arrow): two green and two orange signals.
B: The translocation t(16;16) (p13.1;q22) splits both CBFB and MYH11 loci resulting in two fusion (green-orange) signals located on both derivative chromosomes 16 (indicated by yellow arrows).
C: The inversion inv(16) (p13.1q22) splits both CBFB and MYH11 loci resulting in two fusion (green-orange) signals located on one derivative chromosome 16 (indicated by yellow arrows).
A: Nested PCR – first round of amplification using outer primers. The figure shows that the PCR amplification product about the size 418 bp corresponds to type A (e5e12) of CBFB-MYH11 transcript in two samples of the patient (red arrow); the cyan arrow marks the PCR product of positive control and the green arrow indicates no template control (NTC). On the left, DNA size marker is applied (black arrow).
B: Nested PCR – second round of amplifications using inner primers. The figure shows that the PCR amplification product about the size 271 bp corresponds to type A (e5e12) of CBFB-MYH11 transcript in two samples of the patient (red arrow); cyan arrow marks the PCR product of positive control and the green arrow indicates no template control (NTC). On the left, DNA size marker is applied (black arrow).
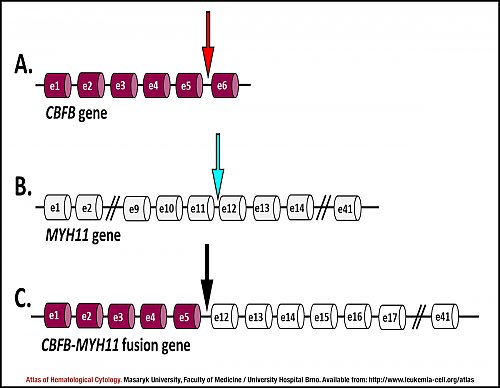
A: Genomic organisation of the CBFB loci. The red arrow indicates a breakpoint between exons e5 and e6 of the CBFB gene.
B: Genomic organisation of the MYH11 loci. The blue arrow indicates a typical breakpoint within the MYH11 gene – between exons e11 and e12.
C: Schematic diagram of the CBFB-MYH11 (type A) fusion gene. The black arrow marks a junction between the CBFB (behind exon e5) and MYH11 (in front of exon e12) genes.
Atlas of Haematological Cytology [online]. 2016 [cit. 2024-4-16]. Available from WWW: http://www.leukemia-cell.org/atlas.
2024 CELL - Atlas of Haematological Cytology | site map
 zoom picture
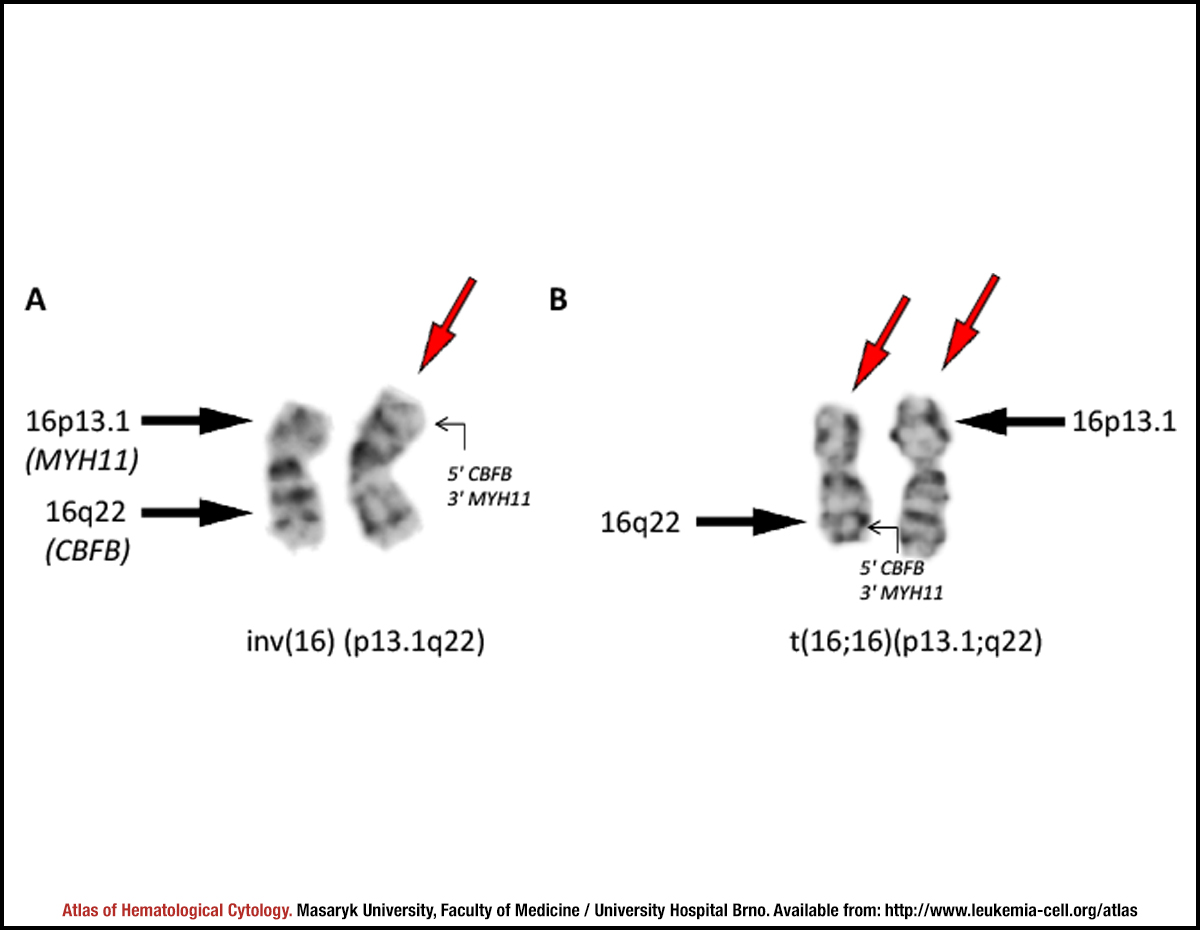 zoom picture
 zoom picture
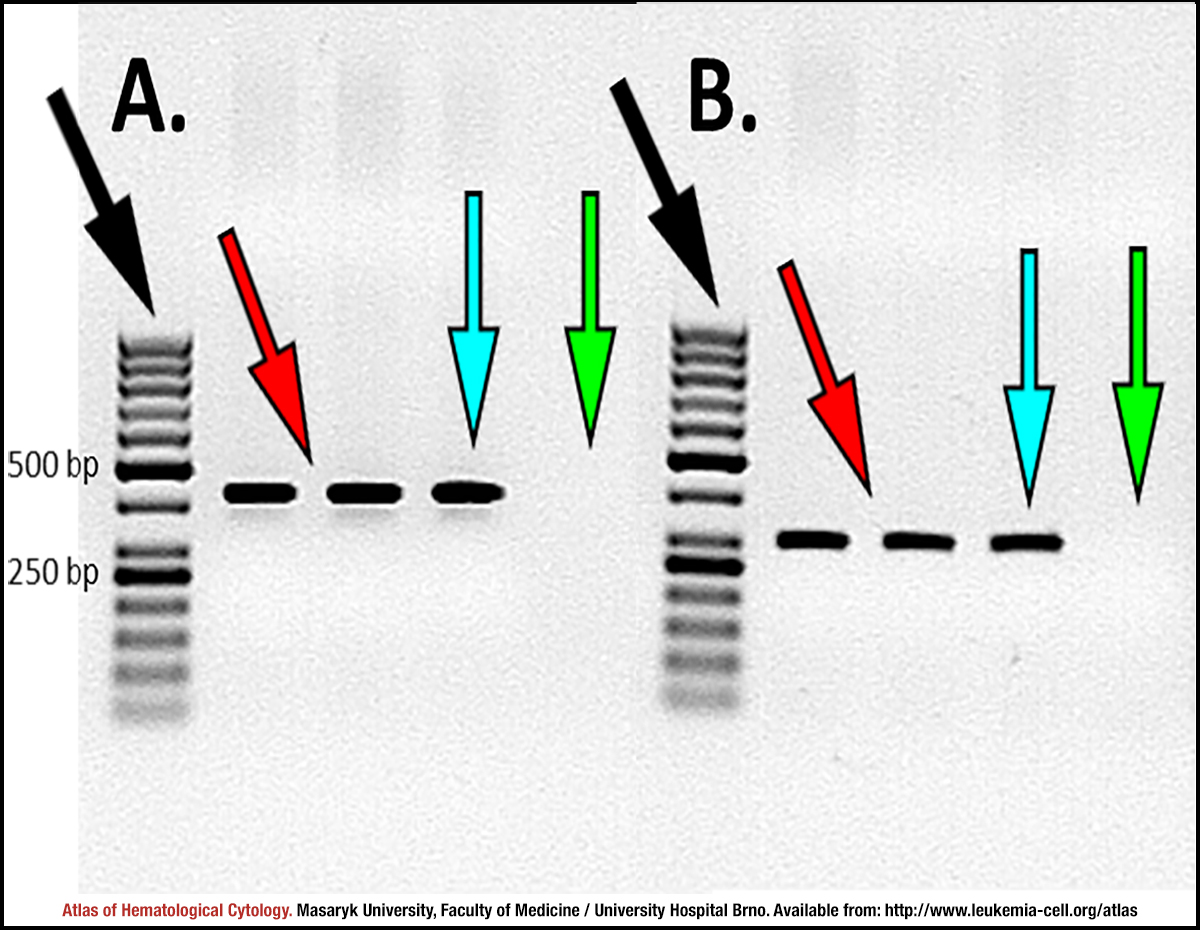 zoom picture
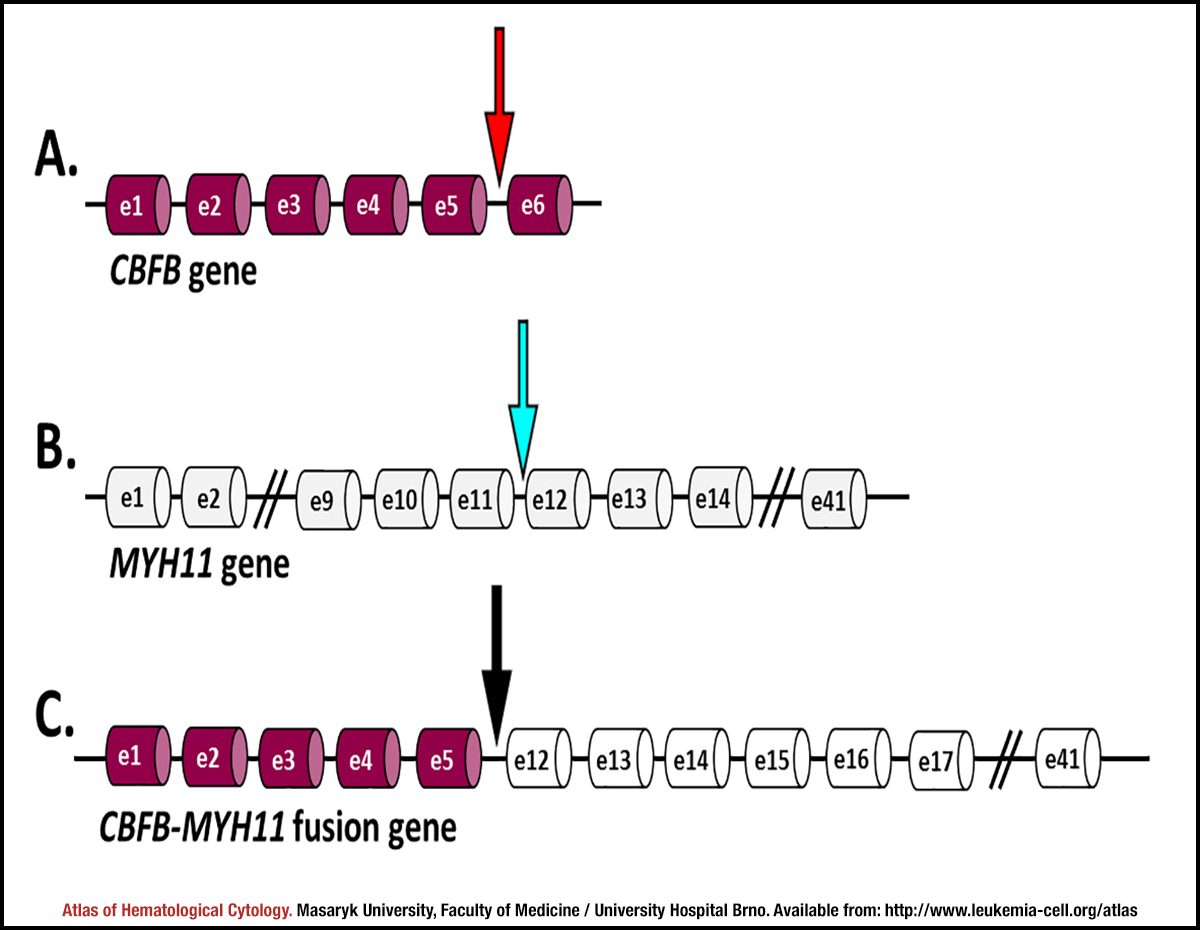 zoom picture