with flowcytometry, cytogenetic and molecular biology findings
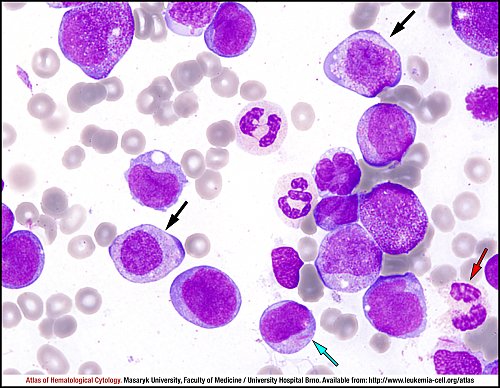
Numerous agranular and granular myeloblasts are present in the bone marrow. Auer rods are also frequently found (blue arrow): they usually have a quite typical morphology – seen as single, long and sharp rods with tapered ends. Granulocytic lineage dysplasia is the second finding; it means an abnormal nuclear segmentation (red arrow) and cytoplasmic staining abnormalities – pink-coloured cytoplasma with the ring of basophilic cytoplasma at the periphery of the cell (black arrows).
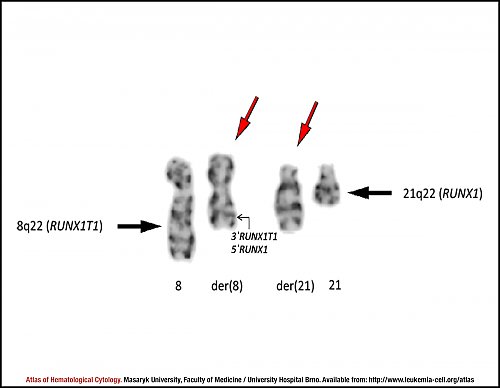
This partial karyotype demonstrates translocation t(8;21)(q22;q22). Red arrows indicate derivative chromosomes 8 and 21. Breakpoint sites are indicated by black arrows. The t(8;21)(q22;q22) results in a juxtaposition of the RUNX1T1 gene (formerly known as ETO) located on 8q22 and the RUNX1 gene (formerly known as AML1) located on 21q22. This juxtaposition generates the fusion gene RUNX1-RUNX1T1 located on the der(8) chromosome.
Fluorescence in situ hybridisation (FISH) of the RUNX1-RUNX1T1 fusion was performed on interphase cells and chromosomes. A dual-colour, dual-fusion FISH probe was used. The orange-labelled probe spans the breakpoint at 21q22.1 RUNX1 (formerly AML1; indicated by a red arrow), whereas the green-labelled probe spans the breakpoint at 8q21.3-22.1 RUNX1T1 (formerly ETO; indicated by a green arrow). The translocation fuses RUNX1 with RUNX1T1 to produce a RUNX1-RUNX1T1 fusion gene located on the derivative chromosome 8 (green-red signal indicated by a yellow arrow).
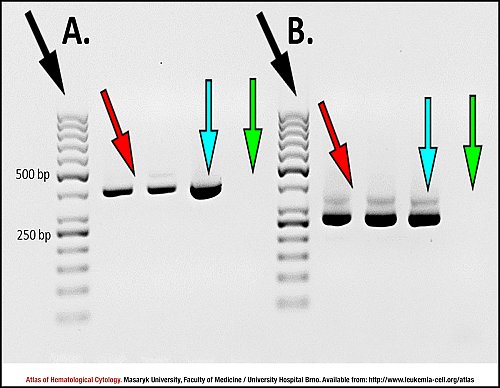
A: Nested PCR – first round of amplification using outer primers. The figure shows that the PCR amplification product about the size 395 bp corresponds to the RUNX1-RUNX1T1 transcript (e5e2) in two samples of the patient (red arrow); the blue arrow marks the PCR product of positive control, whereas the green arrow indicates no template control (NTC). On the left, DNA size marker is applied (black arrow).
B: Nested PCR – second round of amplifications using inner primers. The figure shows that the PCR amplification product about the size 260 bp corresponds to the RUNX1-RUNX1T1 transcript (e5e2) in two samples of the patient (red arrow); the blue arrow marks the PCR product of positive control, whereas the green arrow indicates no template control (NTC). On the left, DNA size marker is applied (black arrow).
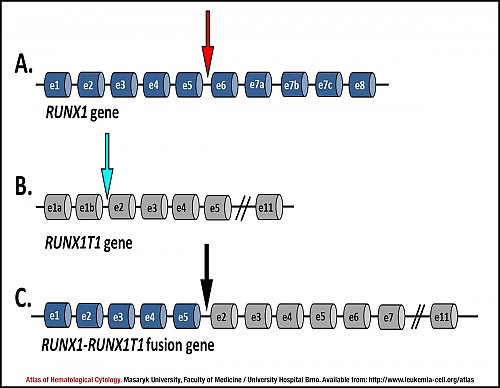
A: Genomic organisation of the RUNX1 loci. The red arrow indicates a breakpoint between exons e5 and e6 of the RUNX1 gene.
B: Genomic organisation of the RUNX1T1 loci. The blue arrow indicates a typical breakpoint within the RUNX1T1 gene – between exons e1 and e2.
C: Schematic diagram of the RUNX1-RUNX1T1 fusion gene. The black arrow marks a junction between the RUNX1 (behind exon e5) and RUNX1T1 (in front of exon e2) genes.
Atlas of Haematological Cytology [online]. 2016 [cit. 2024-4-20]. Available from WWW: http://www.leukemia-cell.org/atlas.
2024 CELL - Atlas of Haematological Cytology | site map
 zoom picture
 zoom picture
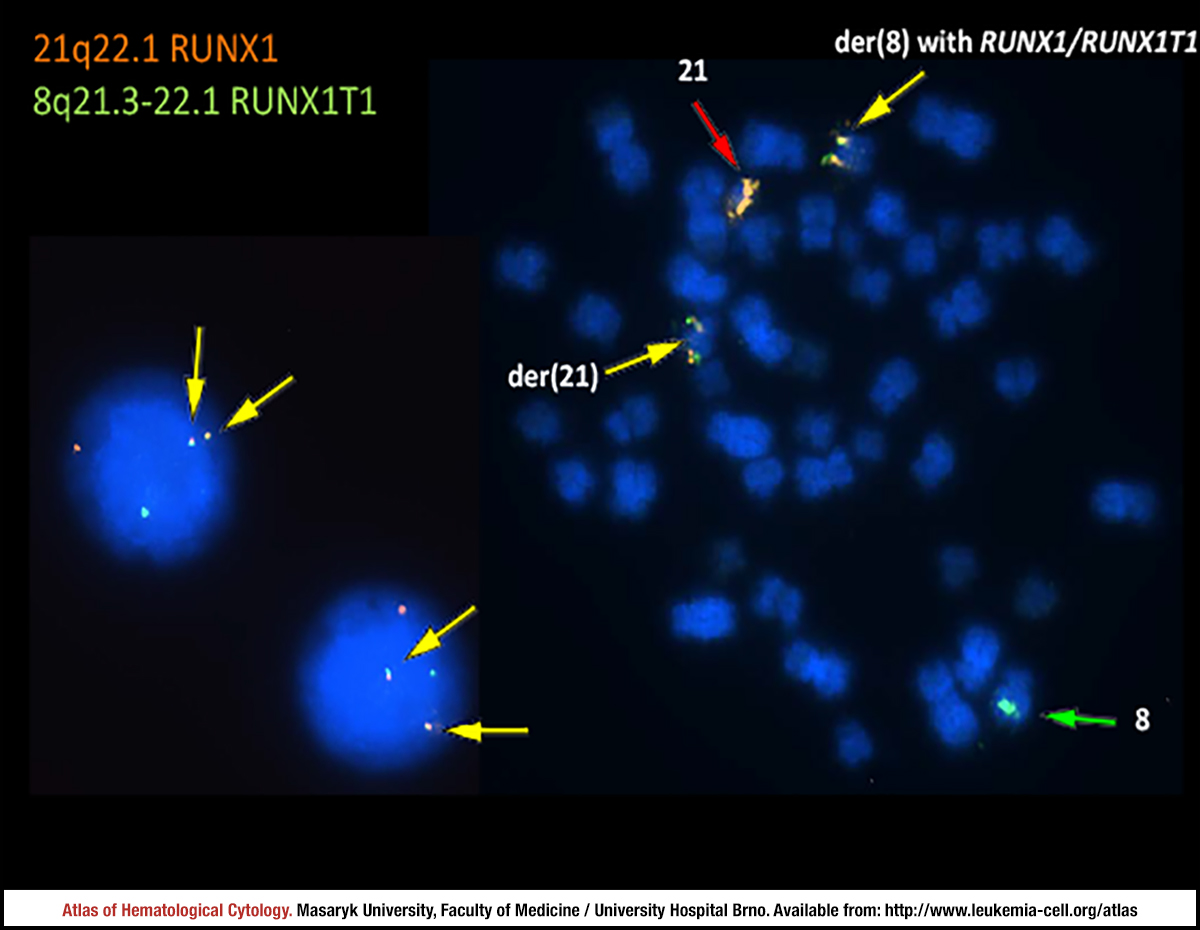 zoom picture
 zoom picture
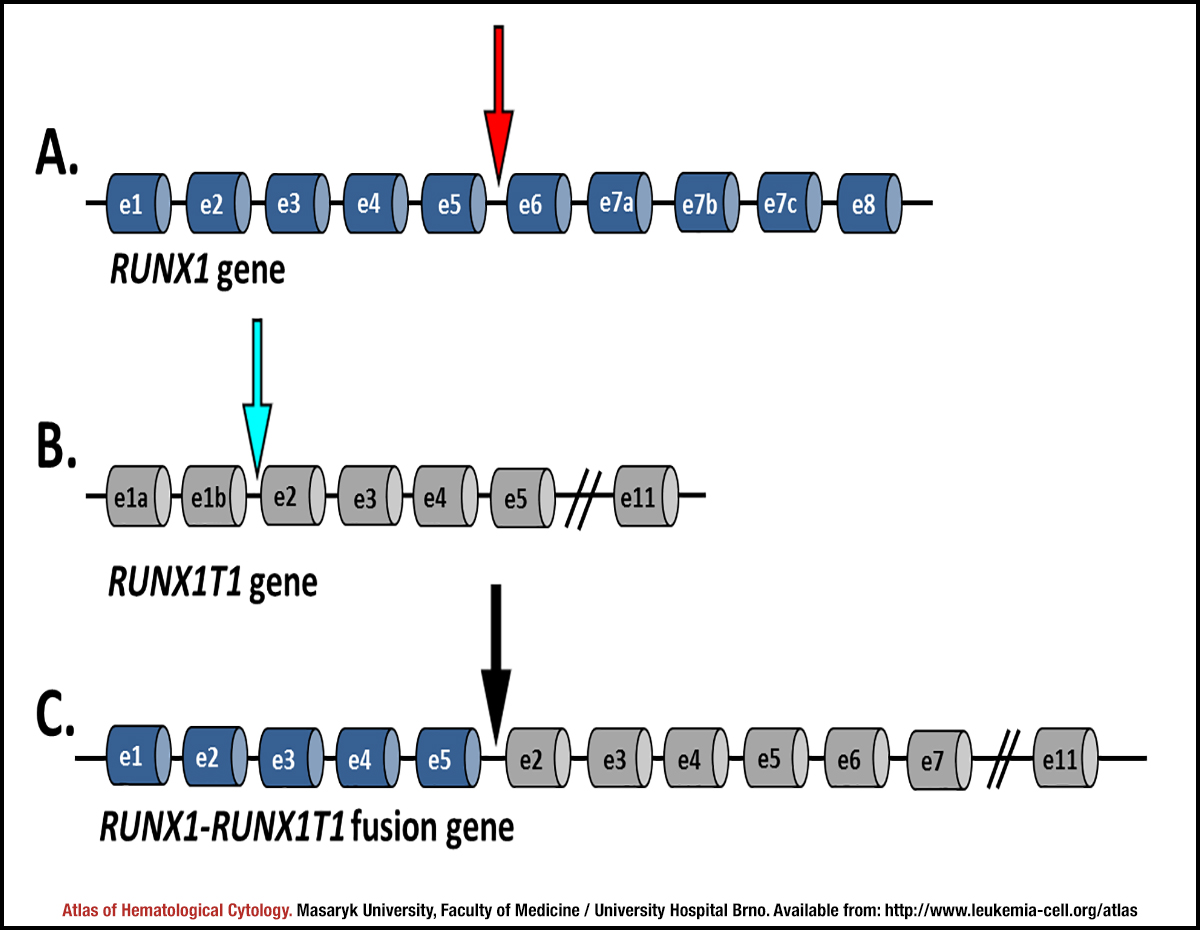 zoom picture