with flowcytometry, cytogenetic and molecular biology findings
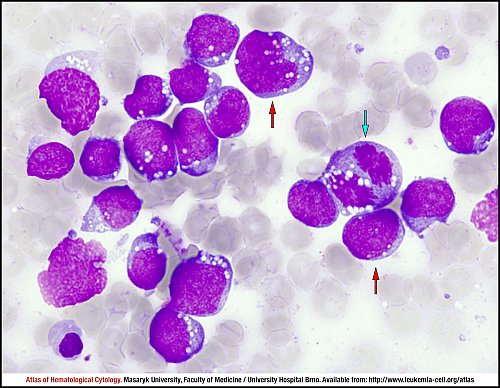
Bone marrow involvement is possible in endemic cases but rather frequent in sporadic cases. The tumour cells are typically medium-size cells and show a diffuse monotonous pattern of growth. The nuclei are round with finely clumped and dispersed chromatin, with basophilic medium-sized, paracentrally located nucleoli (red arrow). The cytoplasm is deeply basophilic and usually contains lipid vacuoles. The tumour has an extremely high proliferation fraction (many mitotic figures – blue arrow).
The analysis of peripheral blood shows a population of BL cells (purple), T lymphocytes (blue), physiological B lymphocytes (brown), all lymphocytes (green), monocytes (yellow) and granulocytes (red). The population of BL cells expresses CD45 and low SS when compared to normal maturating B cells (A); other characteristics involve a positive expression of CD19, CD79b, CD20, a low expression of CD10 and a clonal expression of the light chain kappa or lambda (B–D).
The translocation t(8;14)(q24;q32) is present in approximately 80 % of all Burkitt lymphomas1. The translocation t(8;14)(q24;q32) results in the fusion of the immunoglobulin heavy chain gene (IGH), which is located at 14q32, with the MYC gene, which is located at 8q24. The MYC gene is juxtaposed with enhancer elements of the IGH gene, which leads to an overexpression of the MYC gene. Red arrows indicate derivative chromosomes 8 and 14. Breakpoint sites are indicated by black arrows.
1 Perkins AS, Friedberg JW. Special Problems in B-Cell Lymphoma: Burkitt Lymphoma in Adults. Hematology 2008; 341–348. doi:10.1182/asheducation-2008.1.341.
Fluorescence in situ hybridisation (FISH) of the IGH-MYC fusion was performed on interphase cells. A dual-colour dual-fusion FISH probe was used. The orange-labelled probe spans the breakpoint at 8q24 with the MYC gene (red arrow), whereas the green-labelled probe spans the breakpoint at 14q32 with the IGH region (green arrow). A typical t(8;14) pattern shows one orange signal, one green signal and two fusion signals (yellow arrows), which represents the fusion of IGH and MYC genes.
A. Genomic organisation of the MYC locus. The red arrow indicates a breakpoint between exons e1 and e2 of the MYC gene.
B. Genomic organisation of the IGH locus. The blue arrow indicates a breakpoint between joining regions (JH) and constant regions (Cμ).
C. Schematic diagram of the MYC/IgH translocation. The black arrow marks a junction between the MYC gene and the IgH locus. The MYC gene is juxtaposed to the IgH gene in the opposite orientation.
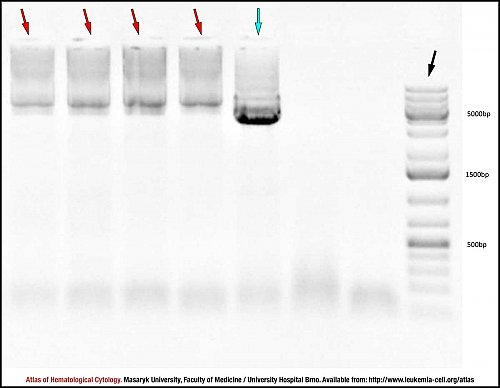
The figure shows long-range PCR amplification products about the size of 6,000 bp corresponding to the MYC/IGH translocation. The red arrows indicate these products amplified in DNA samples extracted from the patient’s tissue and ascites. The blue arrow marks a PCR product of the positive control and the green arrow indicates no template control (NTC). The black arrow points to the DNA fragment size marker.
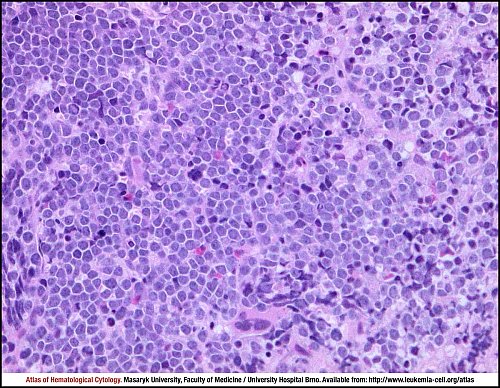
The structure of bone marrow is effaced by a diffuse massive infiltration by medium-sized blastoid cells. In the bone marrow, the typical “starry sky” pattern seen in lymph nodes is usually inconspicuous.
Bone marrow trephine biopsy, haematoxylin and eosin stain.
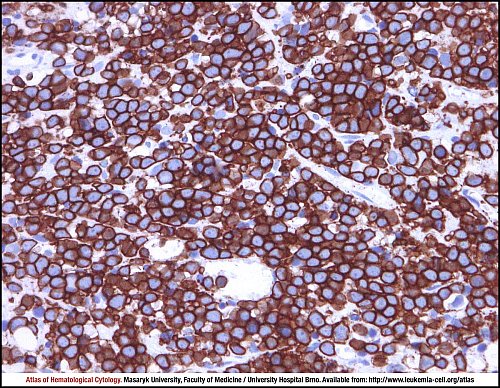
Tumour cells show strong membrane positivity for CD20.
Bone marrow trephine biopsy, immunohistochemistry.
Atlas of Haematological Cytology [online]. 2016 [cit. 2026-5-04]. Available from WWW: http://www.leukemia-cell.org/atlas.
2026 CELL - Atlas of Haematological Cytology | site map
 zoom picture
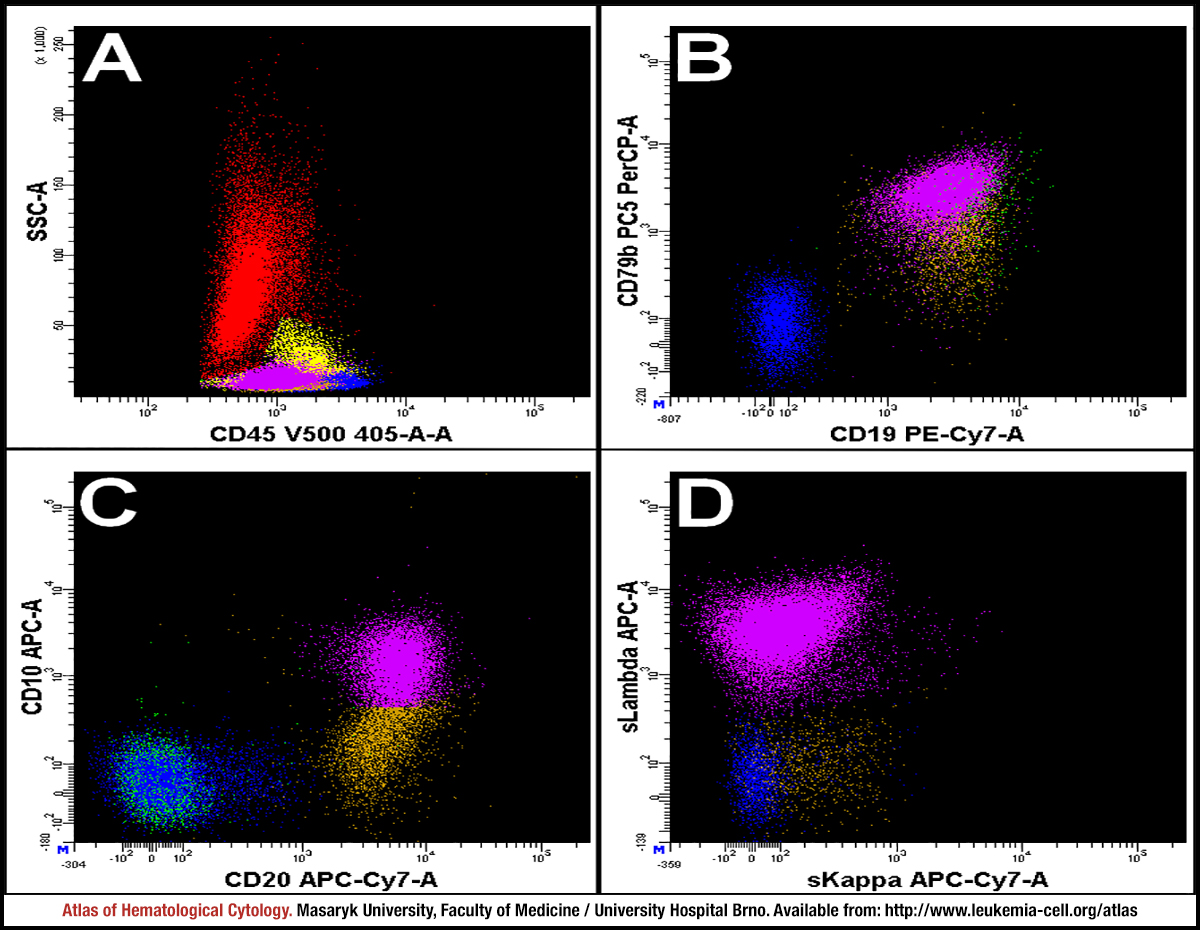 zoom picture
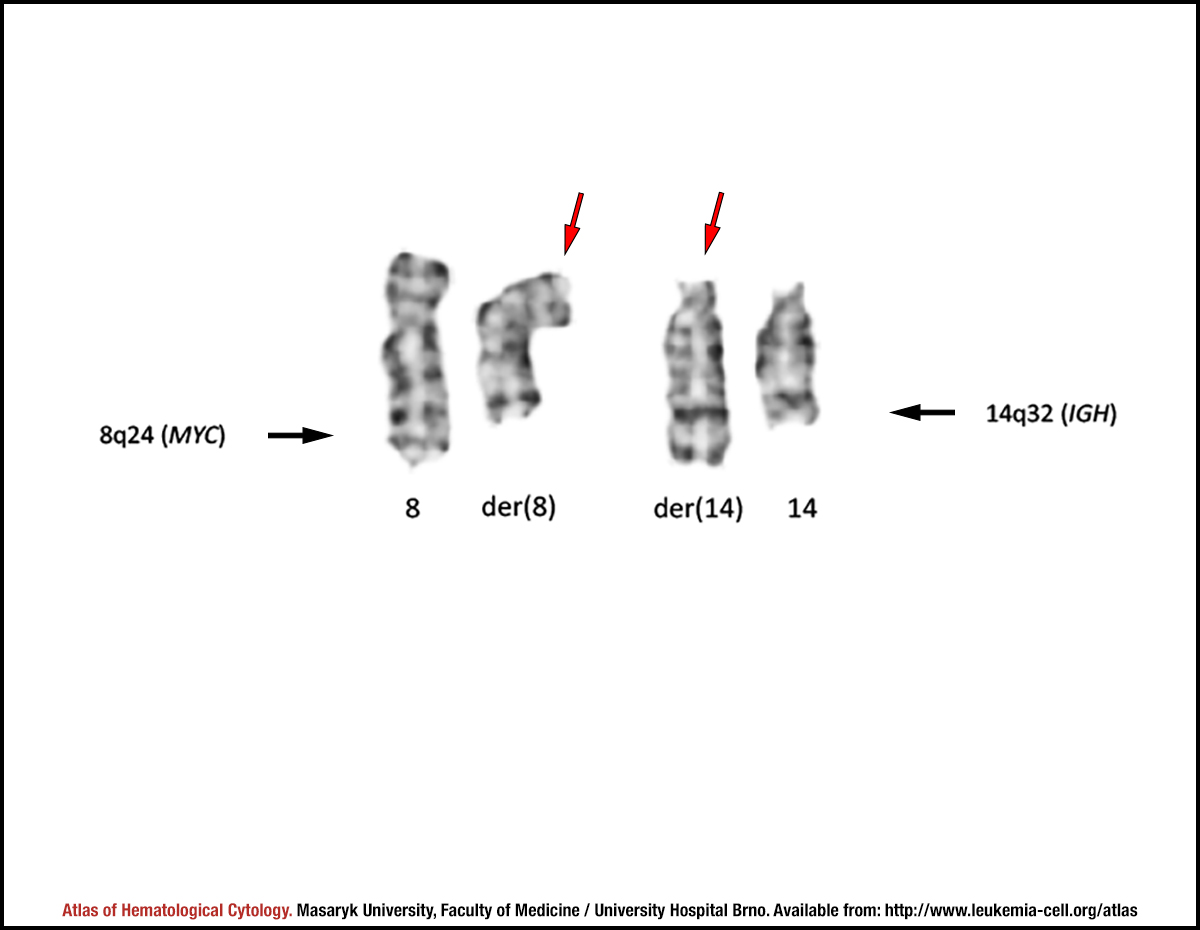 zoom picture
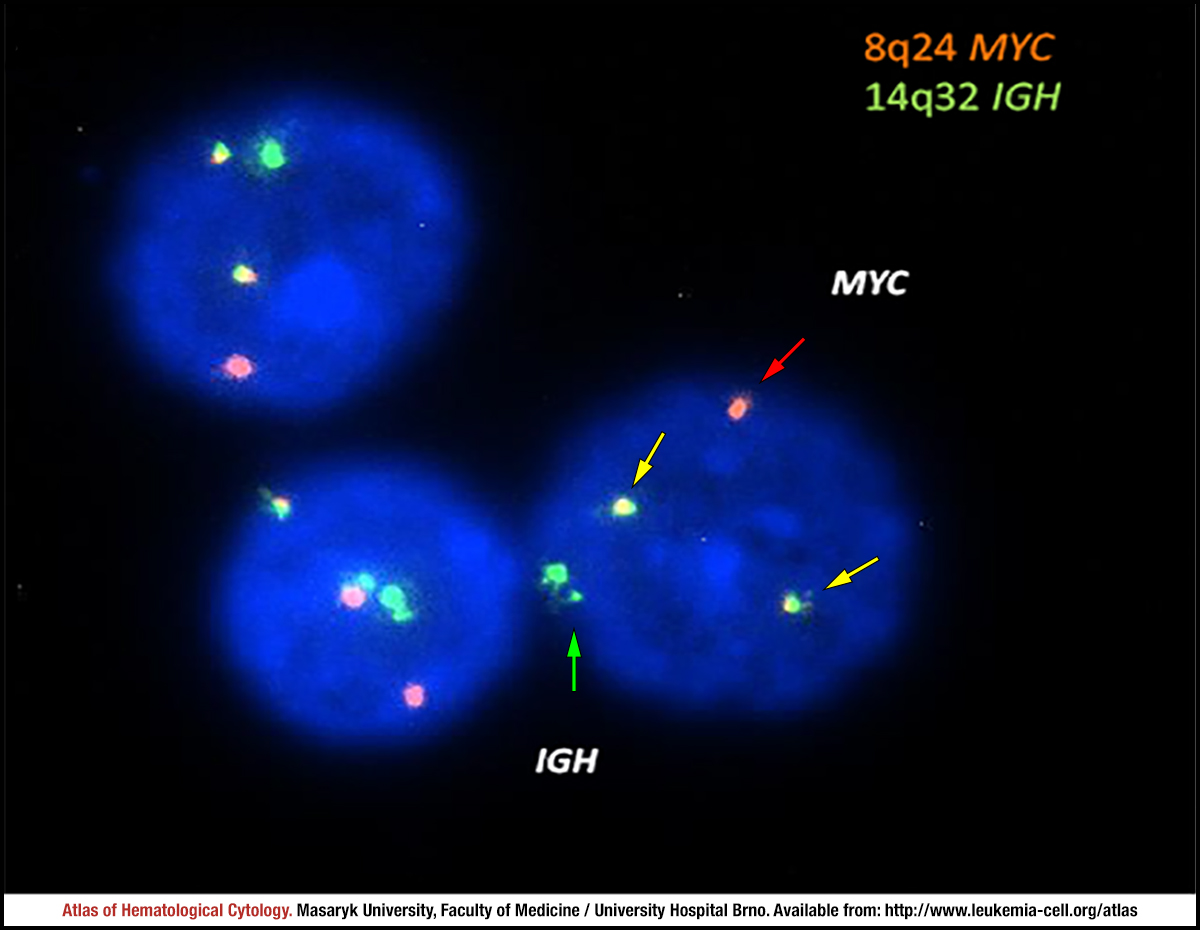 zoom picture
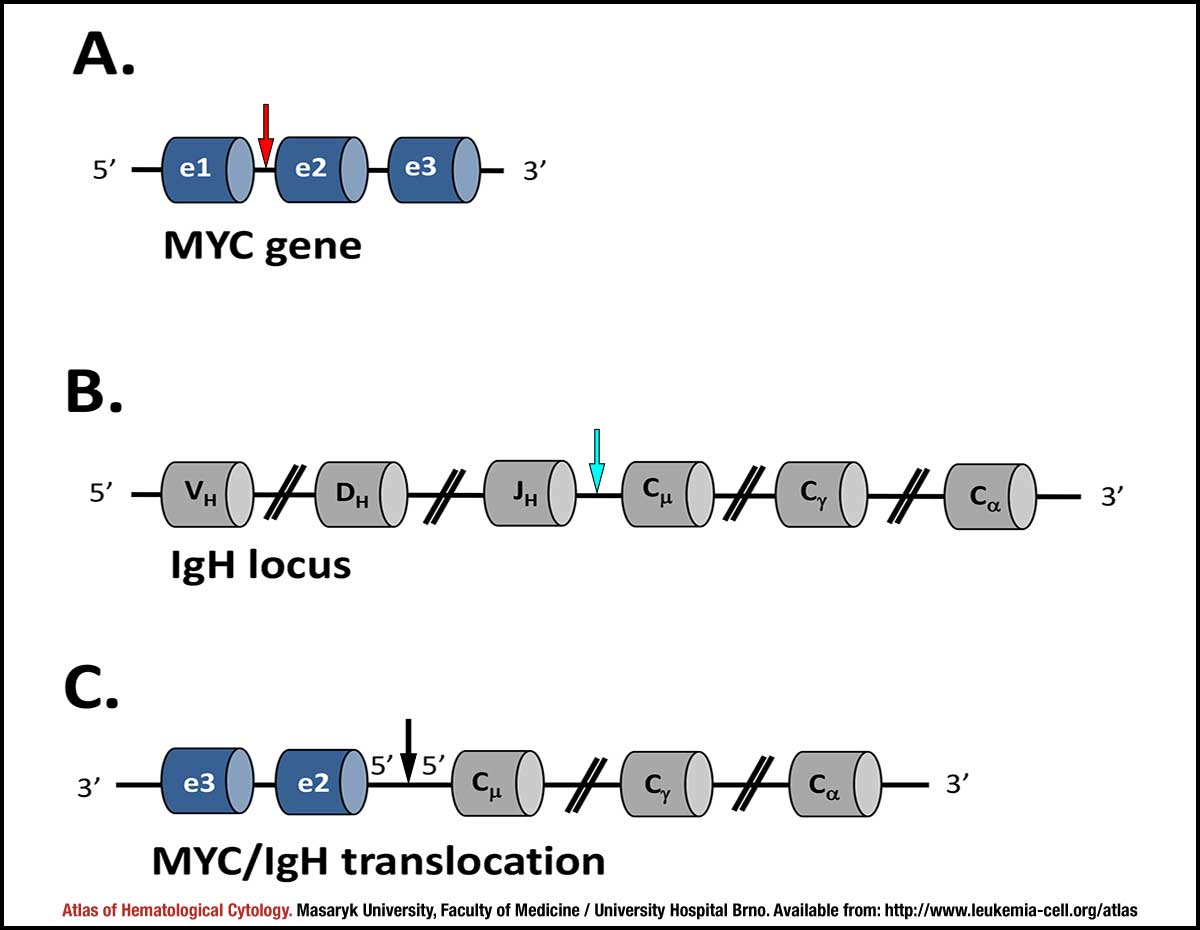 zoom picture
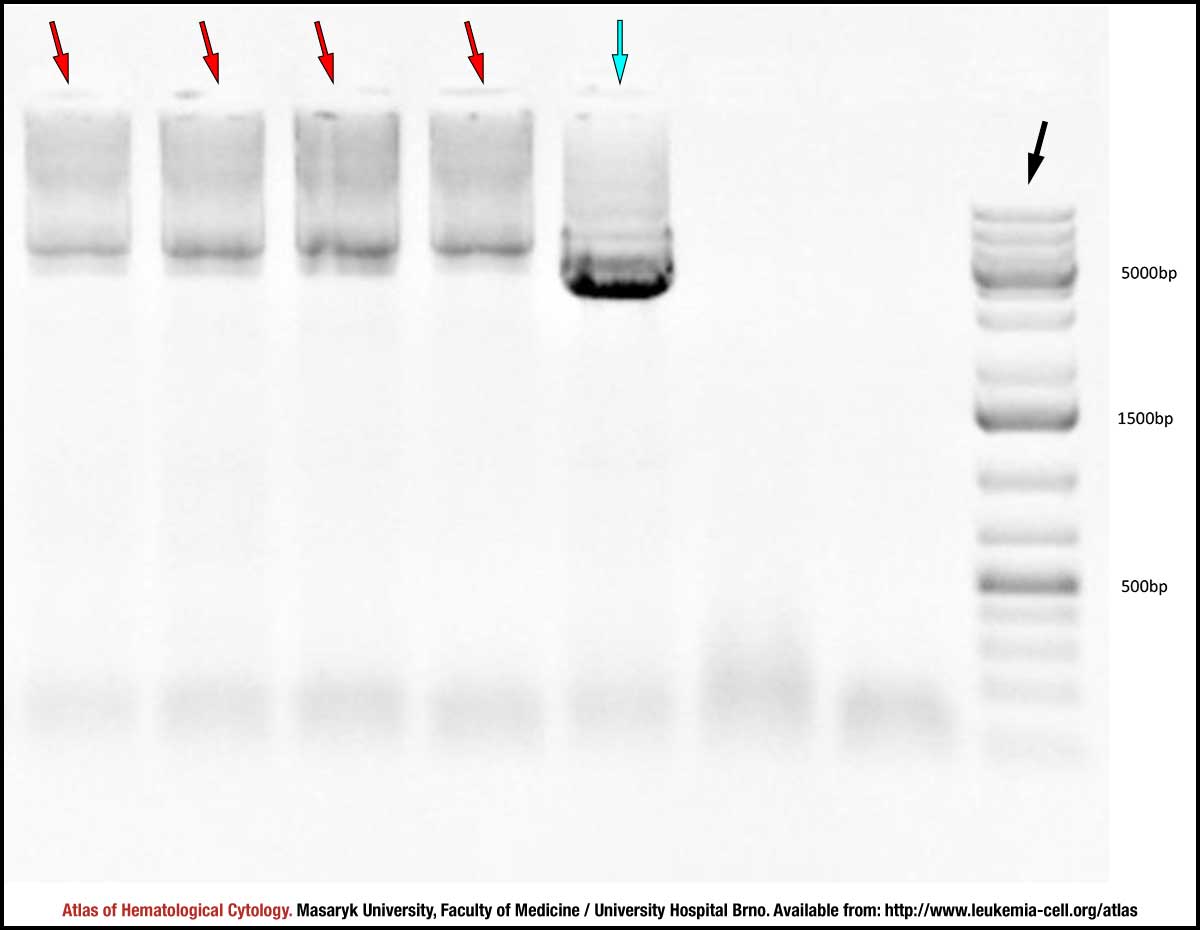 zoom picture
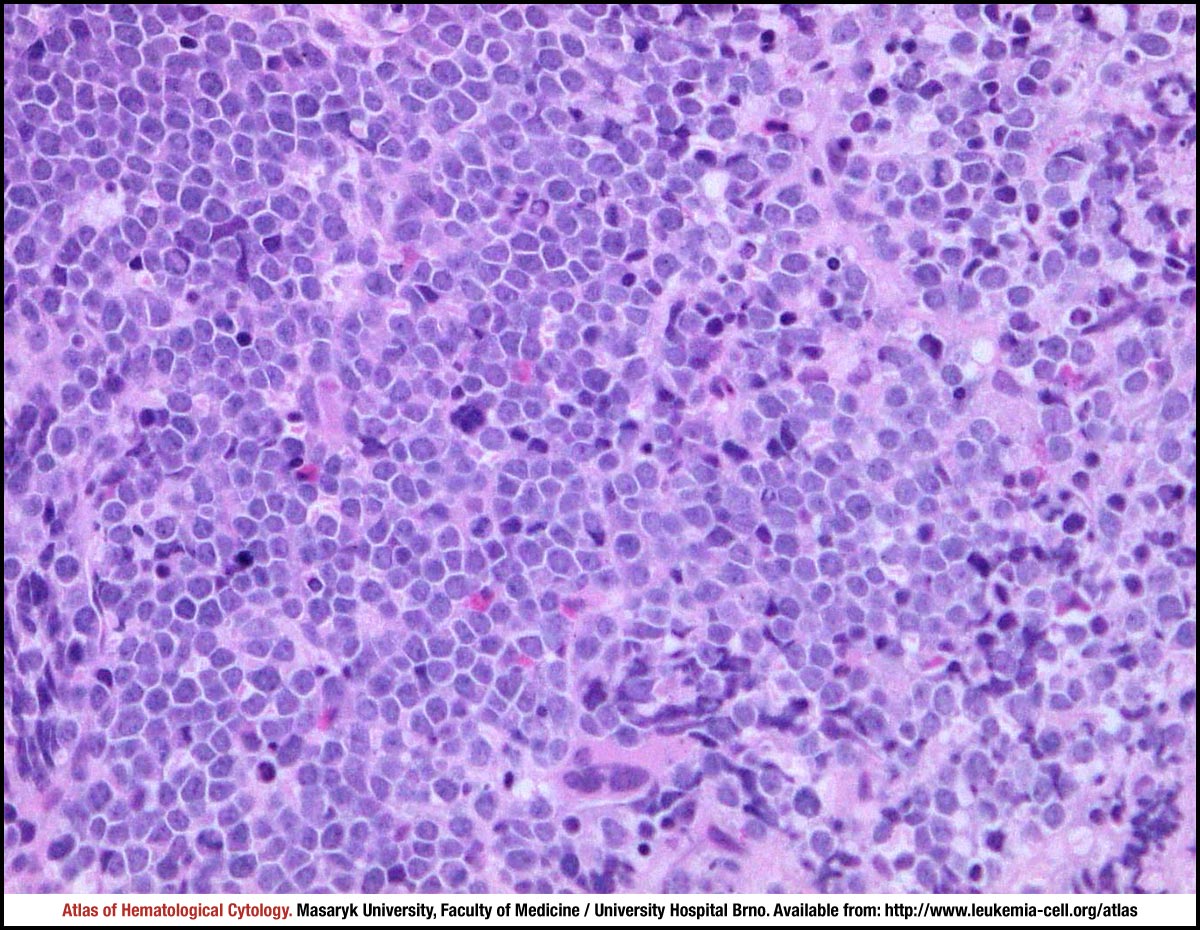 zoom picture
 zoom picture