with flowcytometry, cytogenetic and molecular biology findings
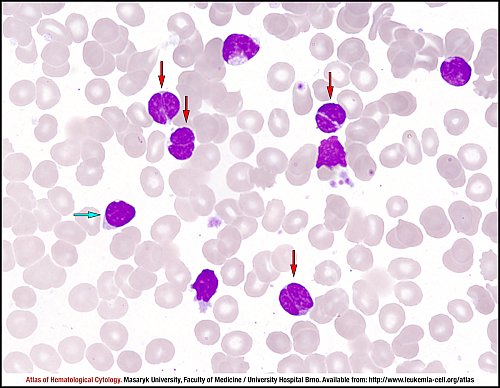
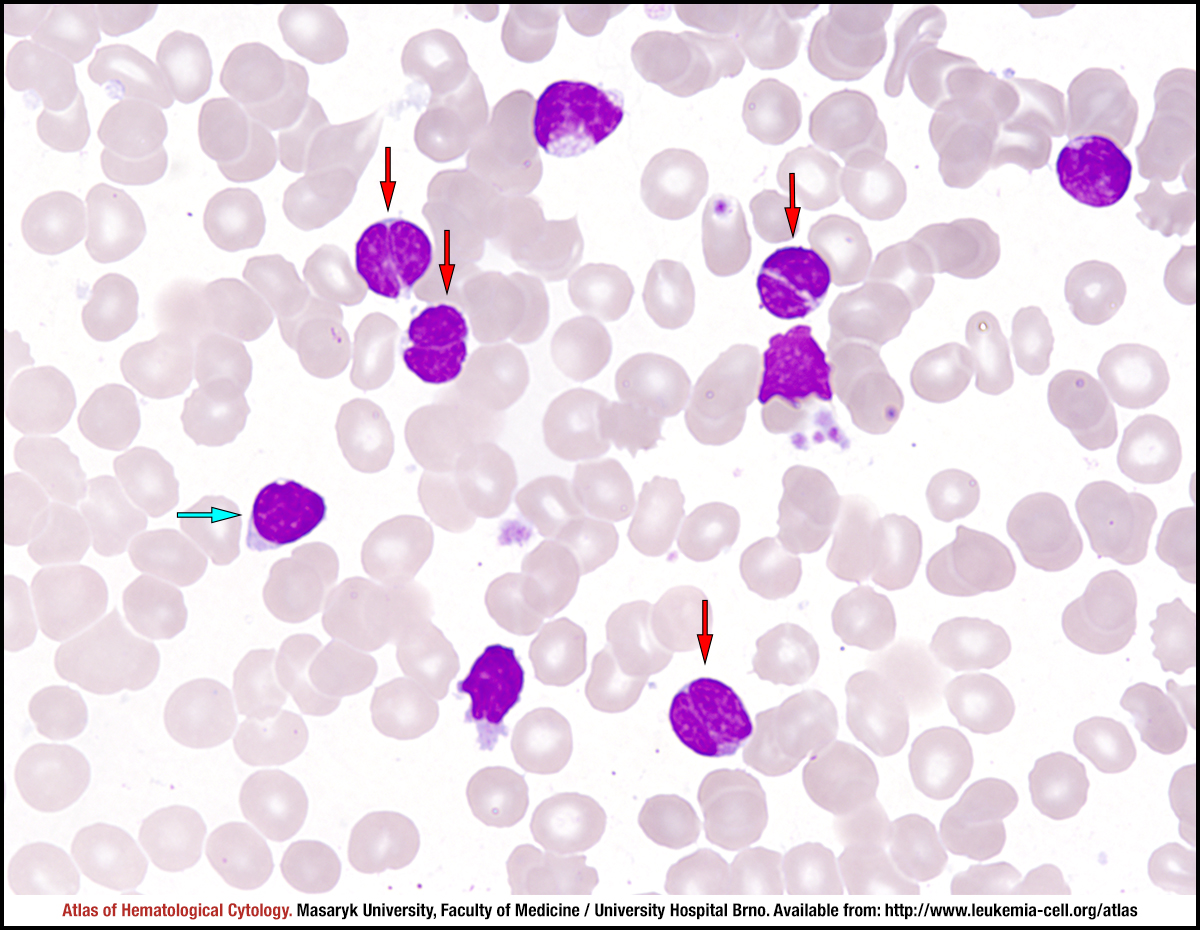
Bone marrow is involved in 40–70% cases of follicular lymphoma. Six cytological features of the disease are distinguished in the cytomorphological examination of peripheral blood or bone marrow smears. Tumour cells are very small, with an almost invisible cytoplasm and with a high nuclear-cytoplasmic ratio; nuclear chromatin is smooth and without a nucleolus, the nuclear outline is irregular and angular (blue arrow), and a high proportion of lymphocytes have deep and narrow clefts (coffee-bean appearance, red arrows).
This imprint of lymph node shows a massive involvement by follicular lymphoma. The neoplastic lymphocytes are very small with a very high nuclear-cytoplasmic ratio, cytoplasm is almost invisible. Nuclear chromatin is dense, nucleoli are not present, most nuclei are deeply cleaved (coffee bean pattern, green arrow). In histological sections, depending on the proportion of centroblasts (yellow arrow), three grades of follicular lymphoma are described.
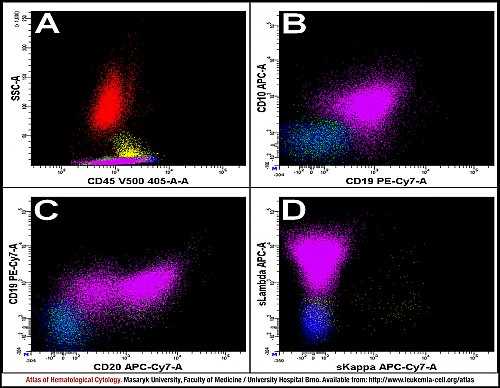
The analysis of peripheral blood shows a population of FL cells (purple), T lymphocytes (blue), physiological B lymphocytes (brown), all lymphocytes (green), monocytes (yellow) and granulocytes (red). The population of FL cells expresses CD45 and low SS when compared to normally mature B cells (A); other characteristics involve a positive expression of CD19, CD20, a low expression of CD10 and a clonal expression of the light chain kappa or lambda (B–D).
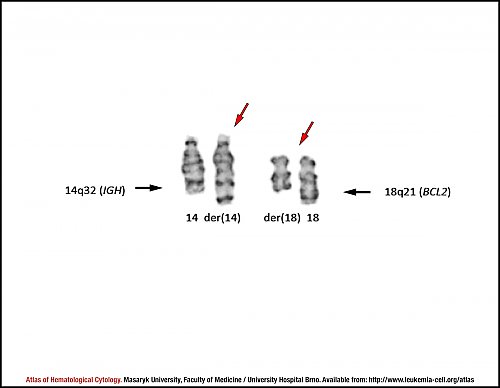
The translocation t(14;18)(q32;q21) is present in approximately 85% of all follicular lymphomas1. The translocation results in the fusion of the immunoglobulin heavy chain gene (IGH), which is located at 14q32, with the BCL2 gene, which is located at 18q21. This translocation leads to a deregulated expression of the antiapoptotic BCL2 proto-oncogene in tumour cells. Red arrows indicate derivative chromosomes 14 and 18. Breakpoint sites are indicated by black arrows.
1 Freedman A. Follicular lymphoma: 2015 update on diagnosis and management. Am J Hematol 2015; 90(12): 1171–1178. doi: 10.1002/ajh.24200.
Fluorescence in situ hybridisation (FISH) of the IGH-BCL2 fusion was performed on interphase cells and chromosomes. A dual-colour dual-fusion FISH probe was used. The orange-labelled probe spans the breakpoint at 18q21, where the BCL2 gene is located (red arrow); the green-labelled probe spans the breakpoint at 14q32 with IGH region (green arrow). The translocation t(14;18)(q32;q21) juxtaposes the IGH enhancer region with the BCL2 proto-oncogene (green-orange signal indicated by a yellow arrow).
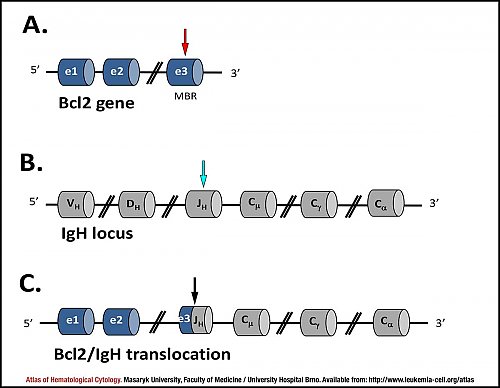
A. Genomic organisation of the BCL2 locus. The red arrow indicates a breakpoint within exon e3 of the BCL2 gene (a major breakpoint region – MBR).
B. Genomic organisation of the IGH locus. The blue arrow indicates a breakpoint within the joining region (JH) of IGH.
C. Schematic diagram of the BCL2/IGH translocation. The black arrow marks a junction between the BCL2 gene and the joining region (JH) of IGH.
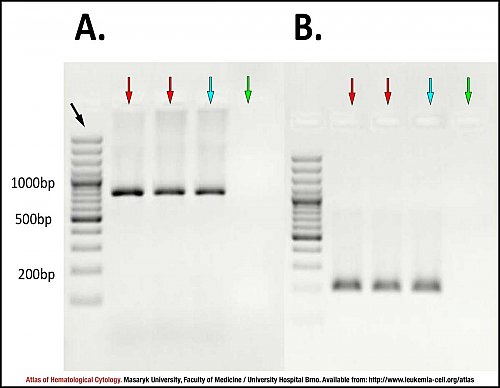
A. Nested PCR – 1st round of amplification using outer primers.
The figure shows PCR amplification products about the size of 800 bp corresponding to the BCL2/IGH translocation in two peripheral blood samples of the patient (red arrows). The blue arrow marks a PCR product of the positive control and the green arrow indicates no template control (NTC). The black arrow points to the DNA fragment size marker.
B. Nested PCR – 2nd round of amplification using inner primers.
The figure shows PCR amplification products about the size of 200 bp corresponding to the BCL2/IGH translocation in two peripheral blood samples of the patient (red arrows). The blue arrow marks a PCR product of the positive control and the green arrow indicates no template control (NTC). The black arrow points to the DNA fragment size marker.
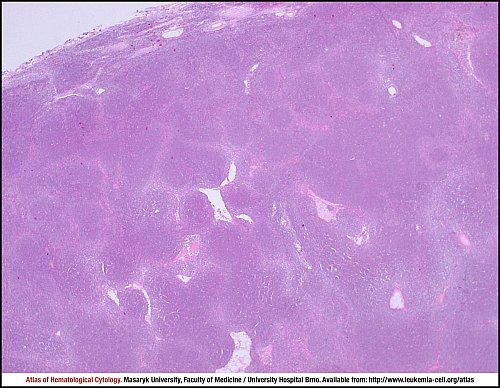
Follicular lymphoma, grade 1. The structure of lymph node is effaced by the lymphoma. The tumour consists of non-confluent nodules of different sizes.
Lymph node biopsy, haematoxylin and eosin stain.
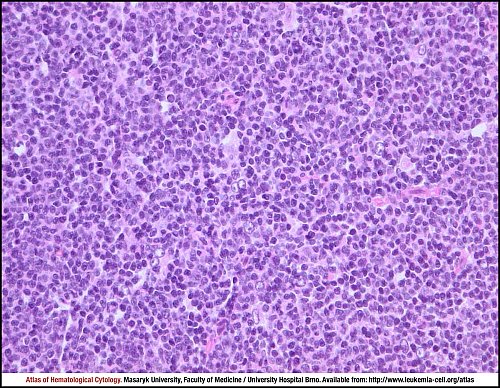
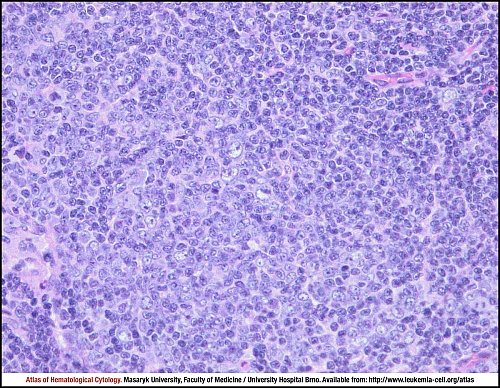
Follicular lymphoma, grade 1. The lymphoma is composed predominantly of small to medium-sized centrocytes, whereas large centroblasts are rather rare (their number does not exceed 50 per 10 high-power fields).
Lymph node biopsy, haematoxylin and eosin stain.
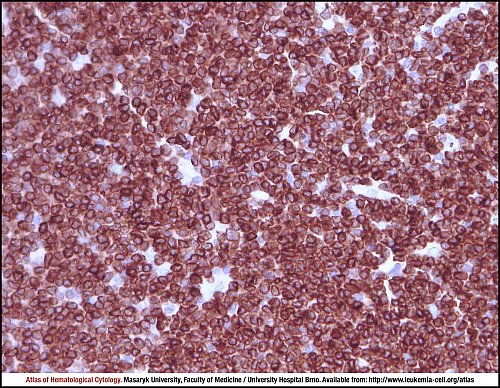
Follicular lymphoma, grade 1. Tumour cells show strong cytoplasmic positivity for BCL2 protein.
Lymph node biopsy, immunohistochemistry.
Follicular lymphoma, grade 3a. The nodular lymphoma is composed of small to medium-sized centrocytes with conspicuous admixture of large centroblasts, whose number is more than 150 per 10 representative high-power fields. Any diffuse area with this cellular composition should be assigned as a diffuse large B cell lymphoma (DLBCL).
Lymph node biopsy, haematoxylin and eosin stain.
Atlas of Haematological Cytology [online]. 2016 [cit. 2026-7-11]. Available from WWW: http://www.leukemia-cell.org/atlas.
2026 CELL - Atlas of Haematological Cytology | site map
 zoom picture
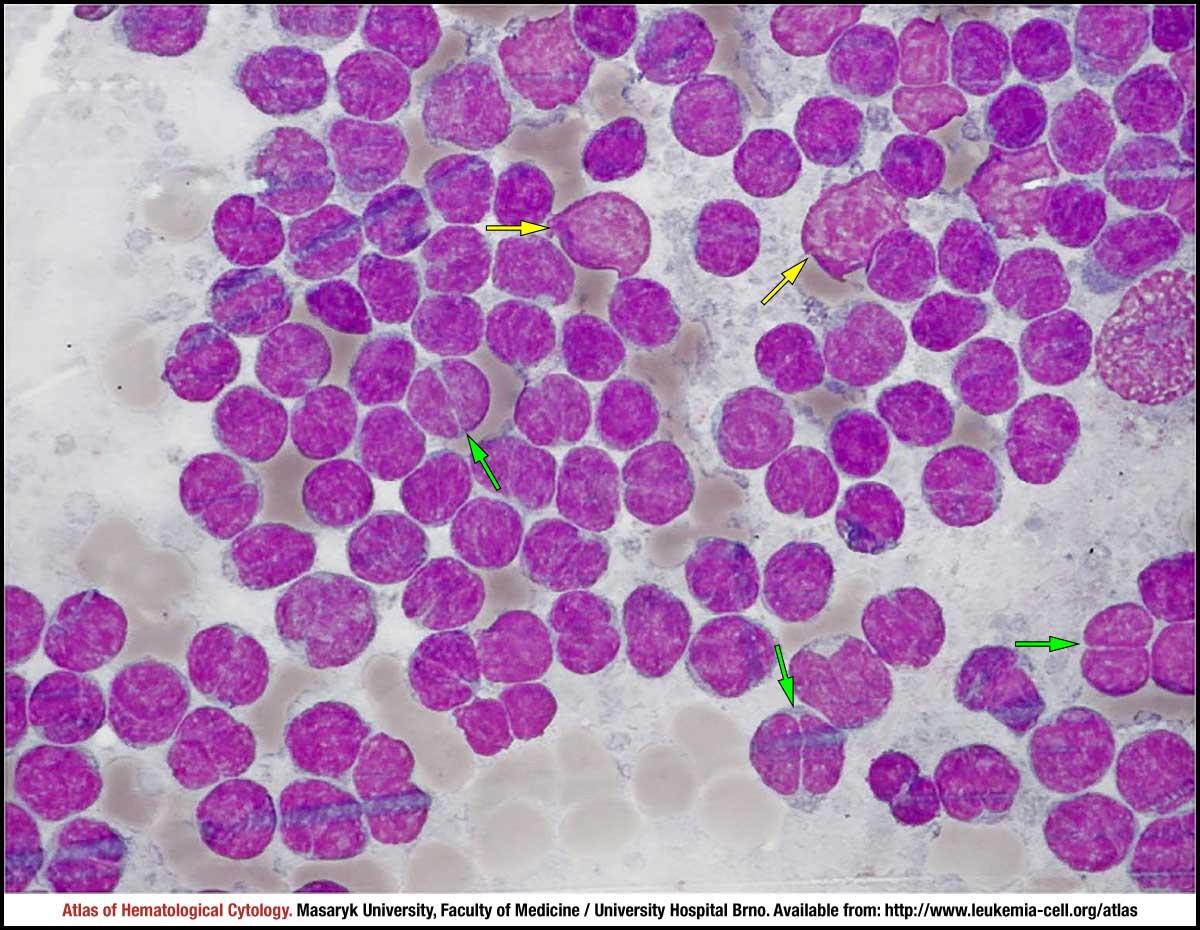 zoom picture
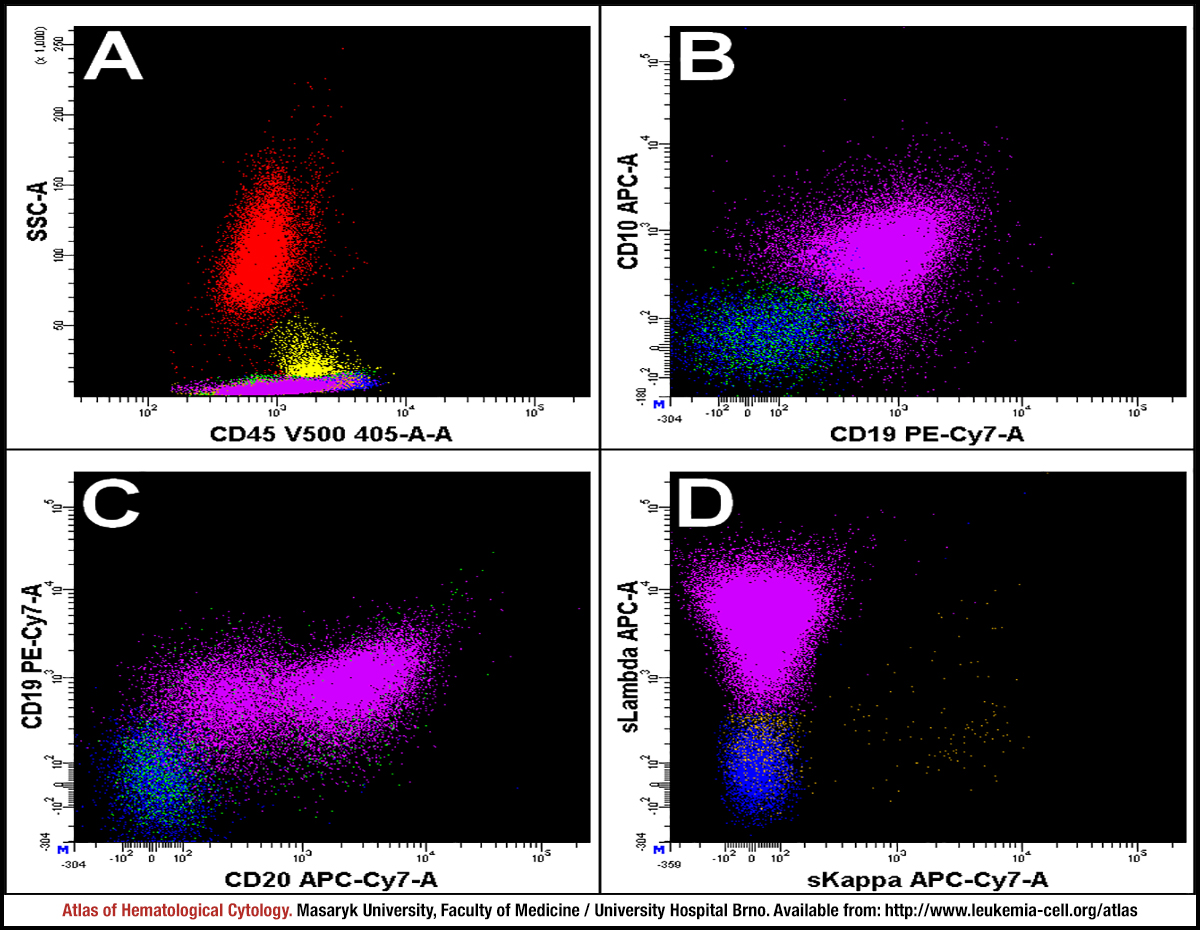 zoom picture
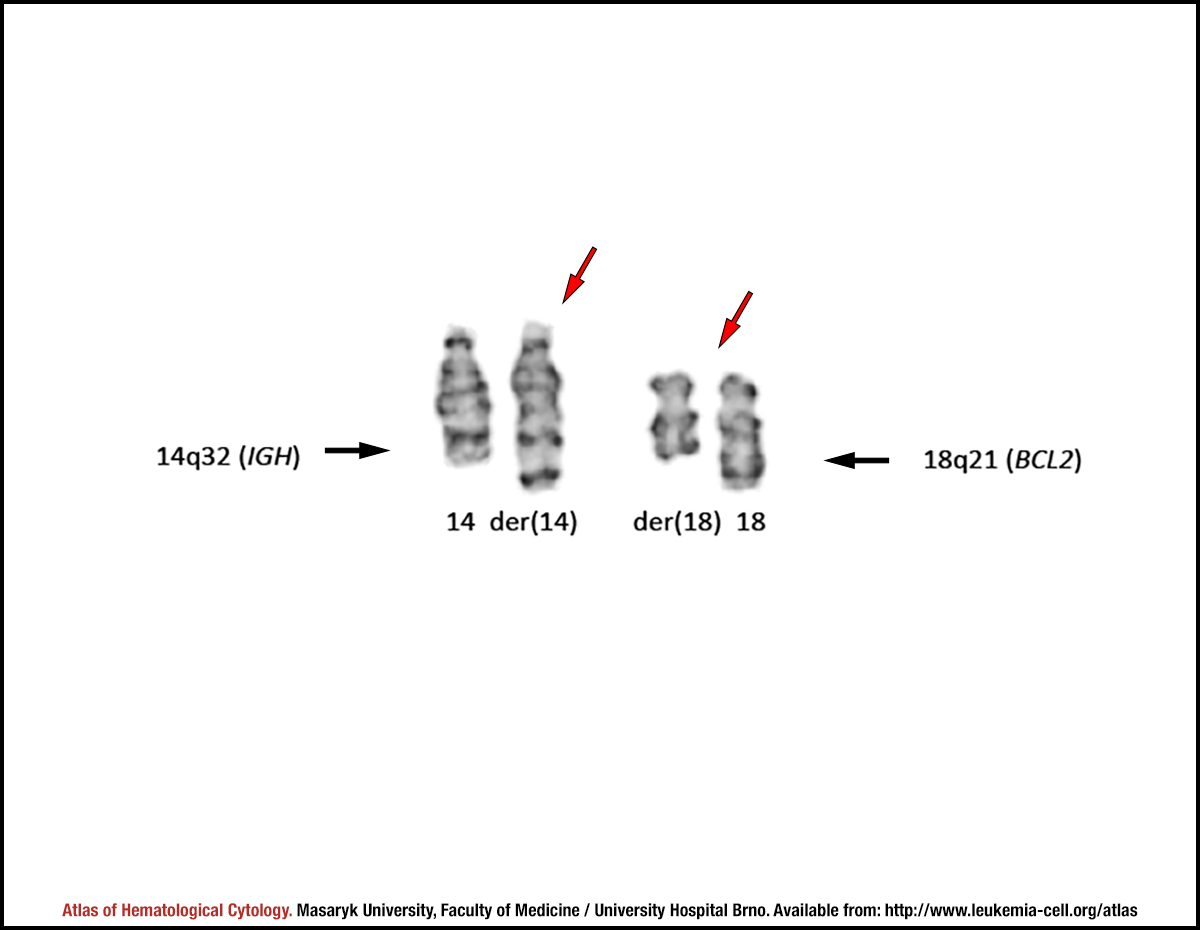 zoom picture
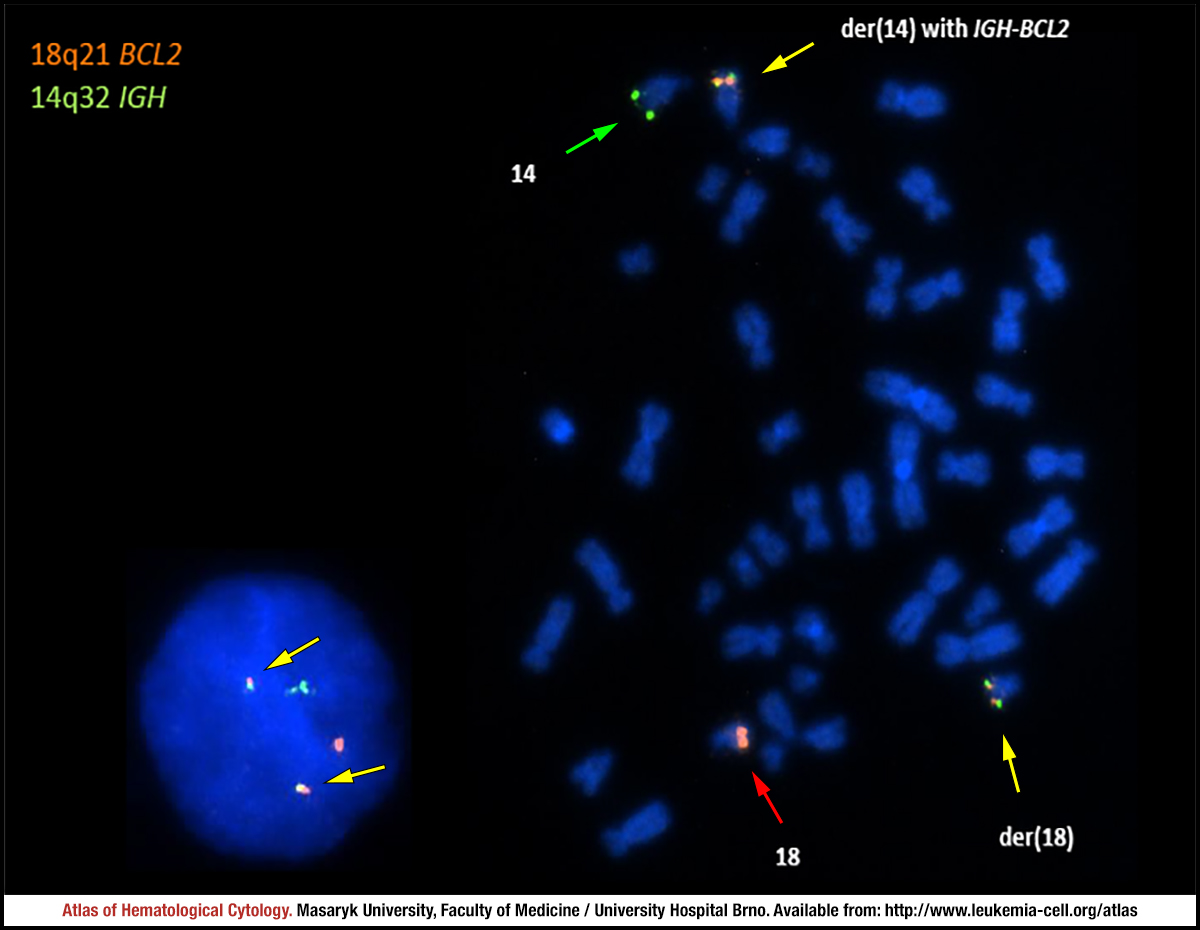 zoom picture
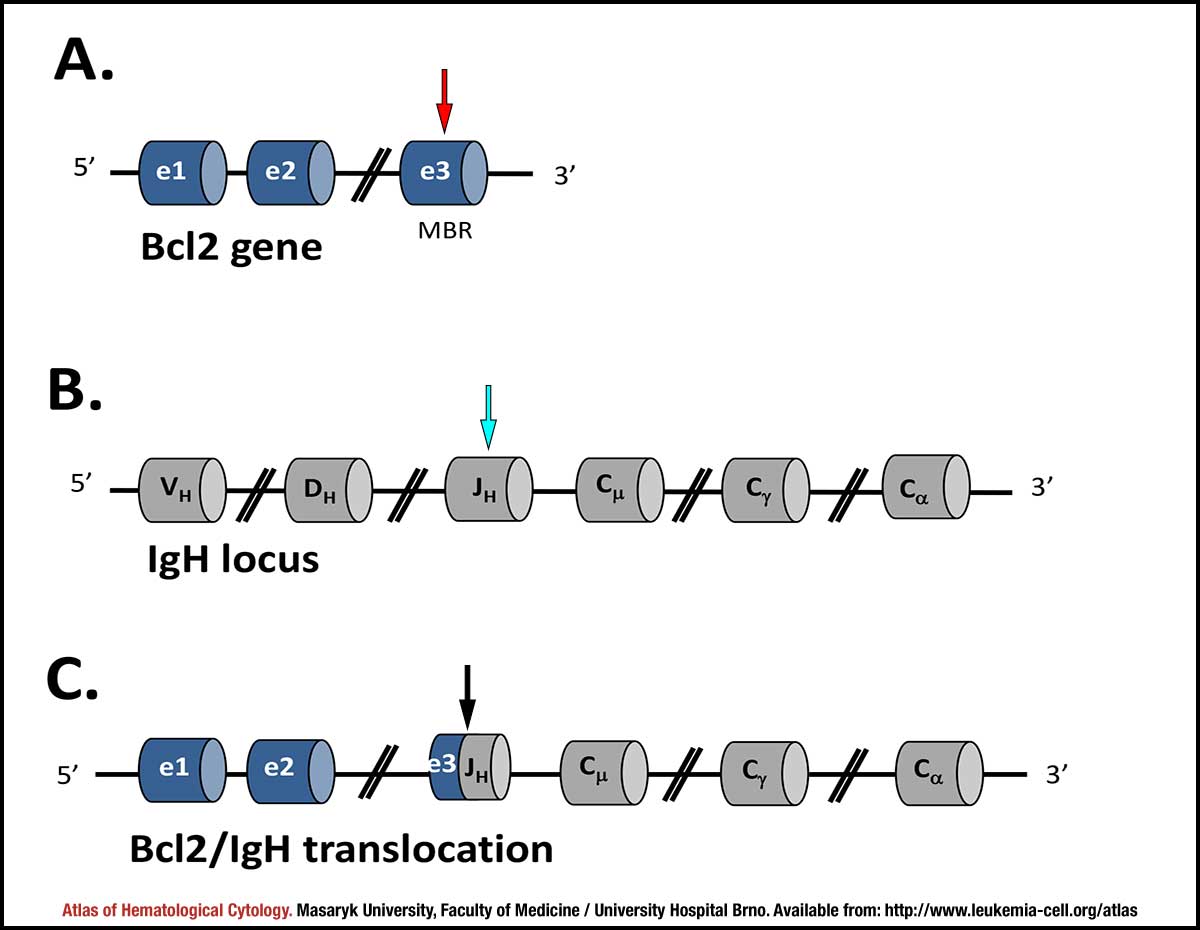 zoom picture
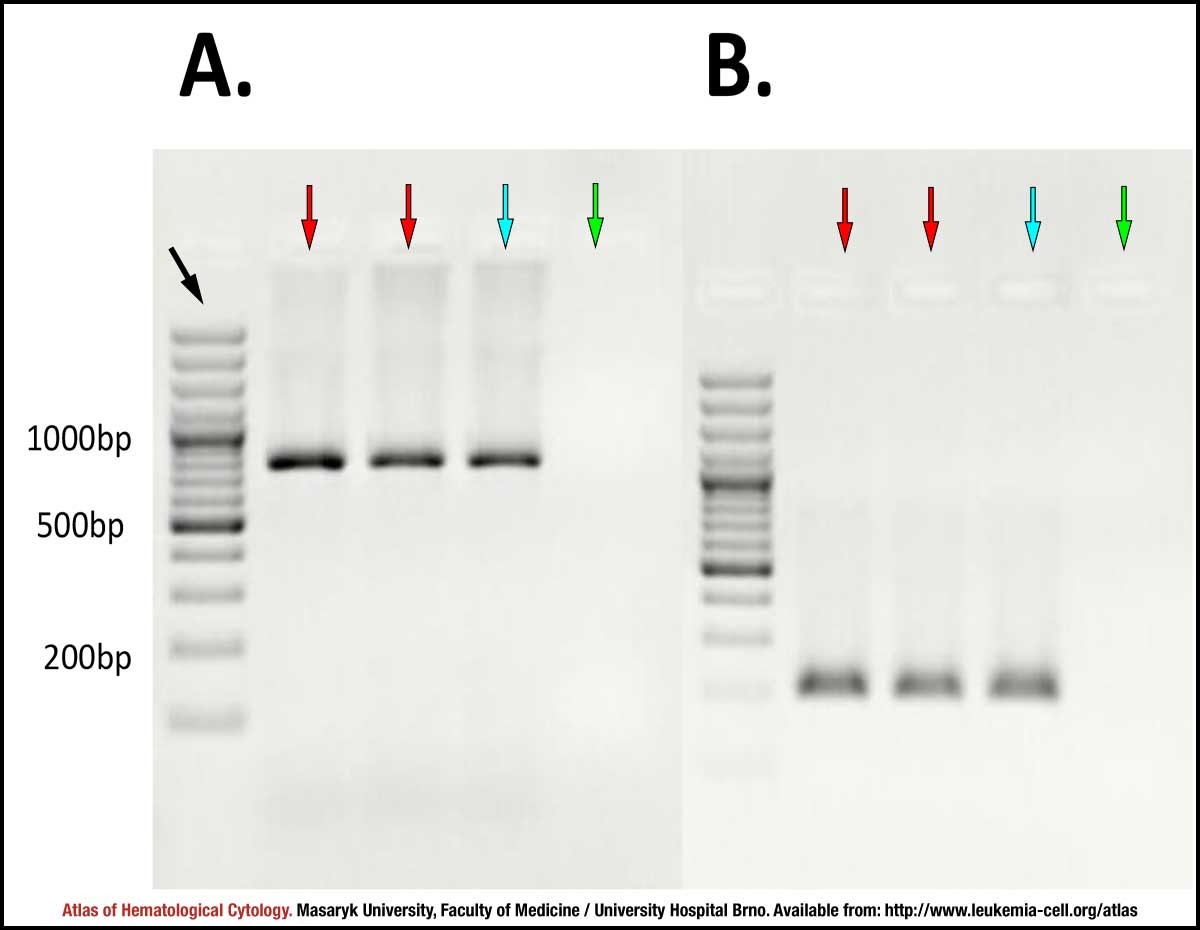 zoom picture
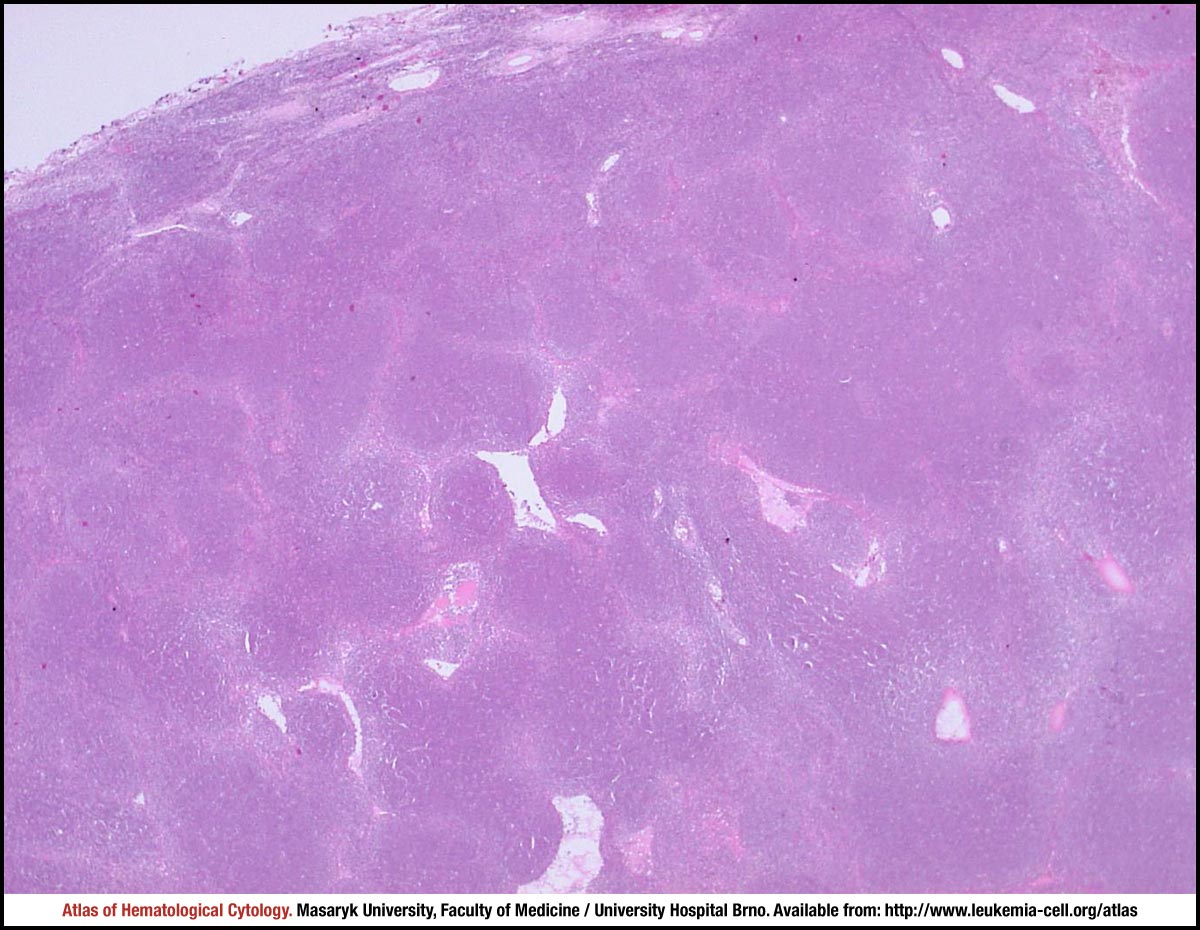 zoom picture
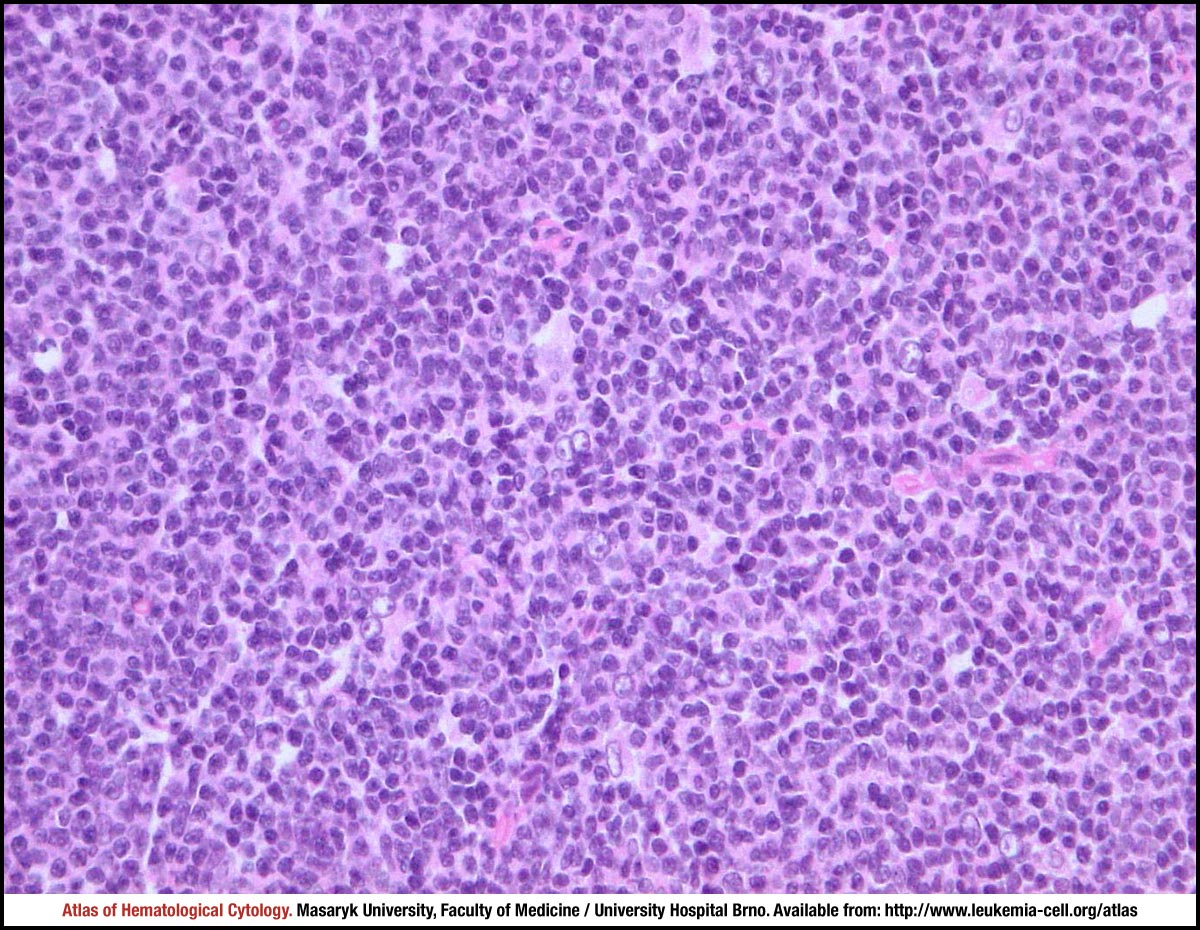 zoom picture
 zoom picture
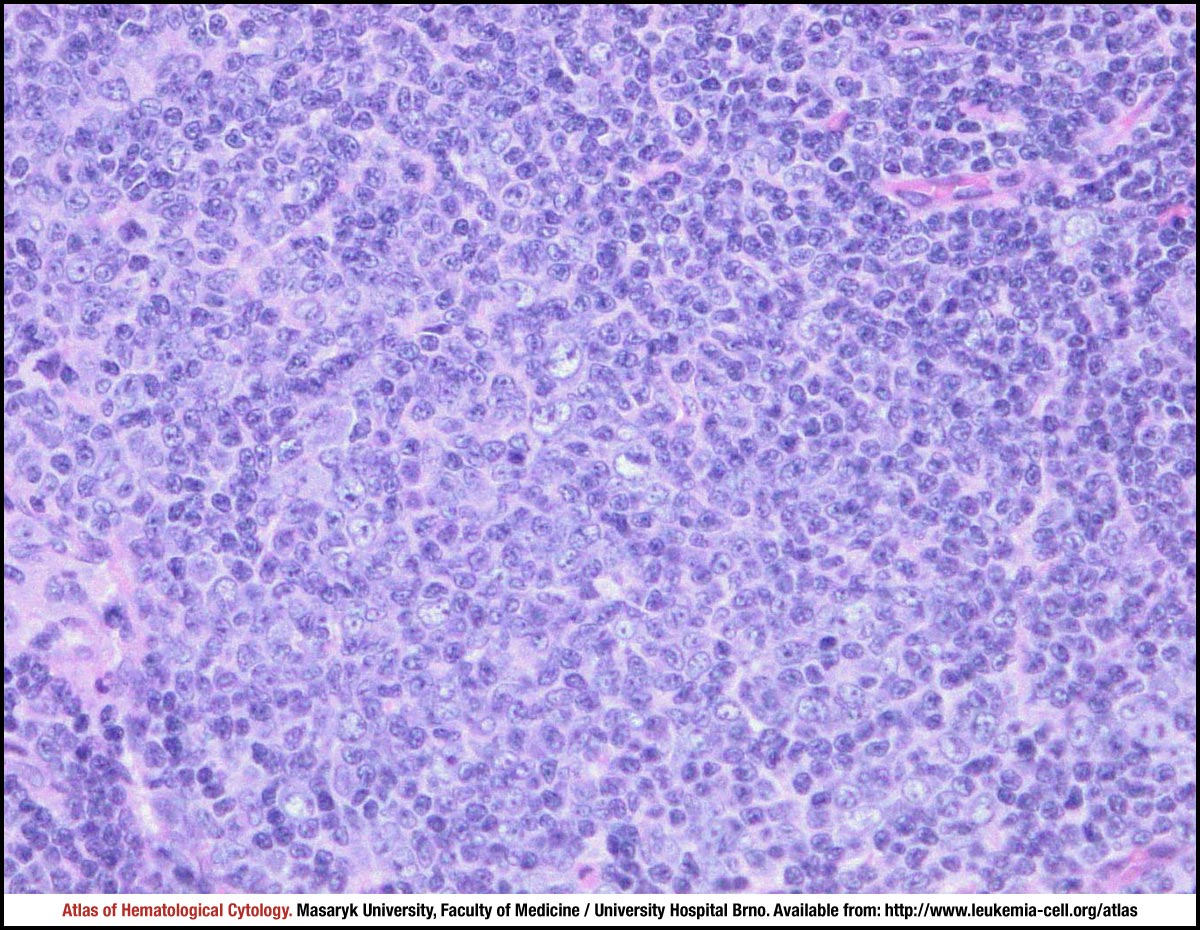 zoom picture