with flowcytometry, cytogenetic and molecular biology findings
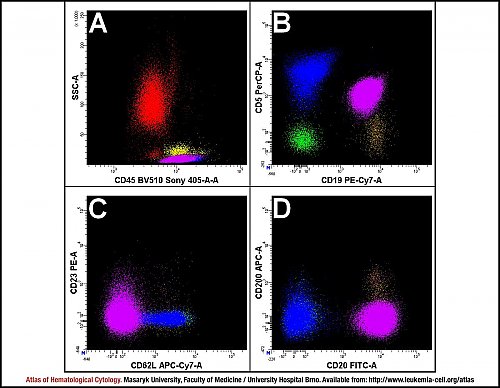
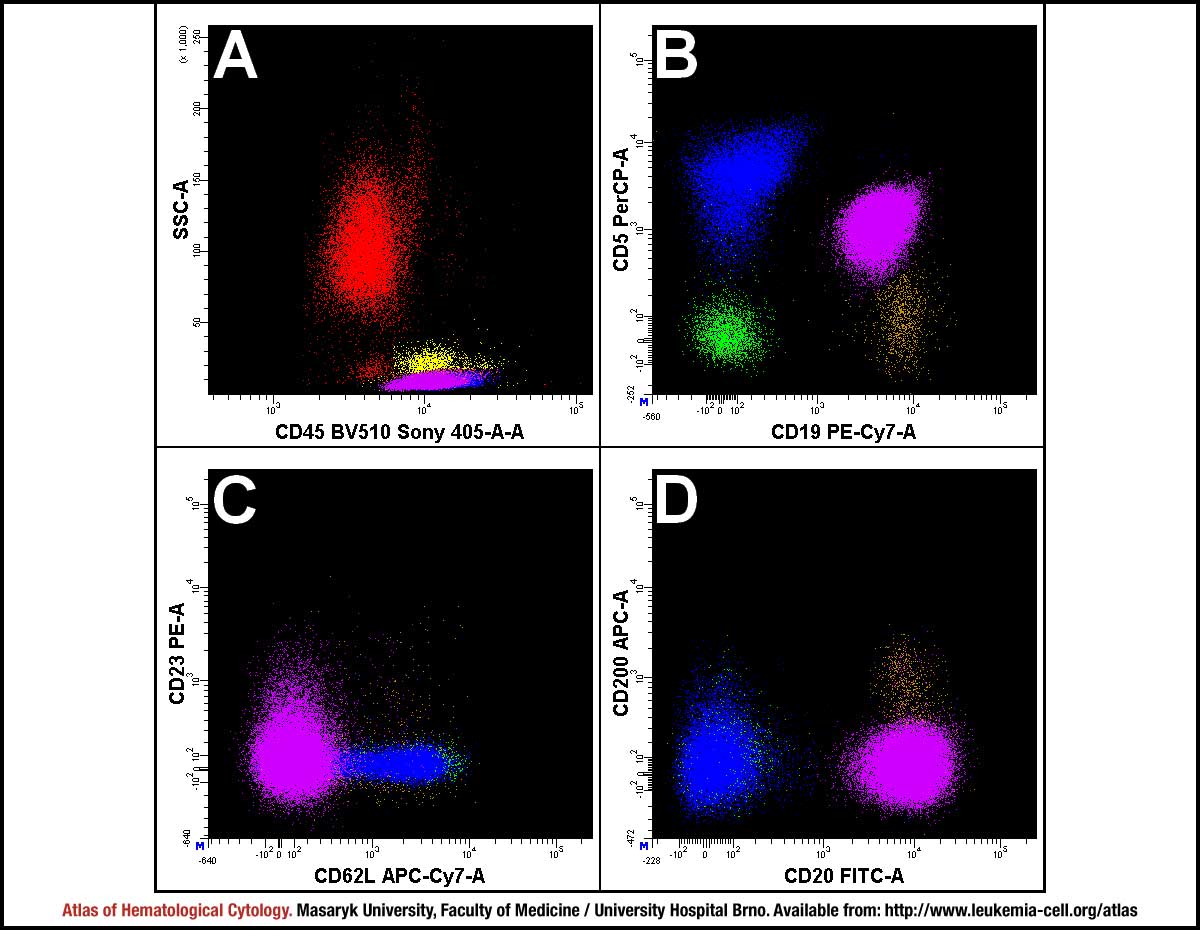
The analysis of peripheral blood shows neoplastic B lymphocytes (purple), T lymphocytes (blue), all lymphocytes (green), monocytes (yellow) and granulocytes (red).
Neoplastic B cells express a high intensity of CD45 and a low intensity of SS (A), and display the characteristic phenotype CD5+ (B), CD23-, CD62L- (C), CD20+ and CD200- (D). Note the negative expression of CD200 and CD23, useful in the diagnosis of CLL.
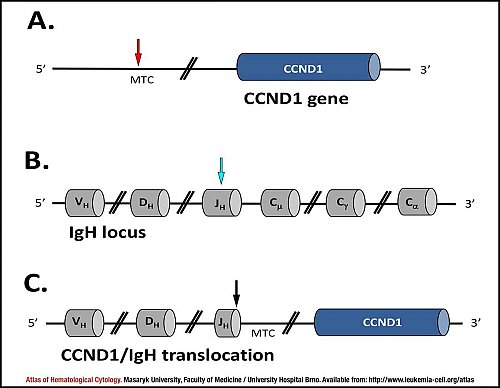
A. Genomic organisation of the CCND1 locus. The red arrow indicates a breakpoint in the major translocation cluster (MTC) which is localised approximately 120 kb centromerically from the CCND1 gene.
B. Genomic organisation of the IGH locus. The blue arrow indicates a breakpoint within the joining region (JH) of IGH.
C. Schematic diagram of the CCND1/IGH translocation. The black arrow marks a junction between the MTC and the joining region (JH) of IGH.
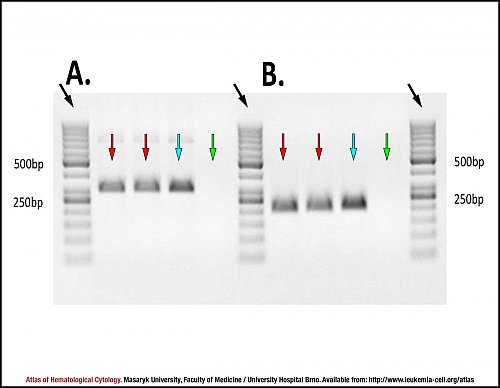
A. Nested PCR – 1st round of amplification using outer primers.
The figure shows PCR amplification products about the size of 300 bp corresponding to the CCND1/IGH translocation in two patient samples (red arrows). The blue arrow marks a PCR product of the positive control and the green arrow indicates no template control (NTC). The black arrow points to the DNA fragment size marker.
B. Nested PCR – 2nd round of amplifications using inner primers.
The figure shows PCR amplification products about the size of 200 bp corresponding to the CCND1/IGH translocation in two patient samples (red arrows). The blue arrow marks a PCR product of the positive control and the green arrow indicates no template control (NTC). The black arrow points to the DNA fragment size marker.
In this classical variant, the mantle cell lymphoma is composed of medium-sized cells with centrocytoid nuclei. Mitotic activity is conspicuous.
Lymph node biopsy, haematoxylin and eosin stain.
Atlas of Haematological Cytology [online]. 2016 [cit. 2024-4-25]. Available from WWW: http://www.leukemia-cell.org/atlas.
2024 CELL - Atlas of Haematological Cytology | site map
 zoom picture
 zoom picture
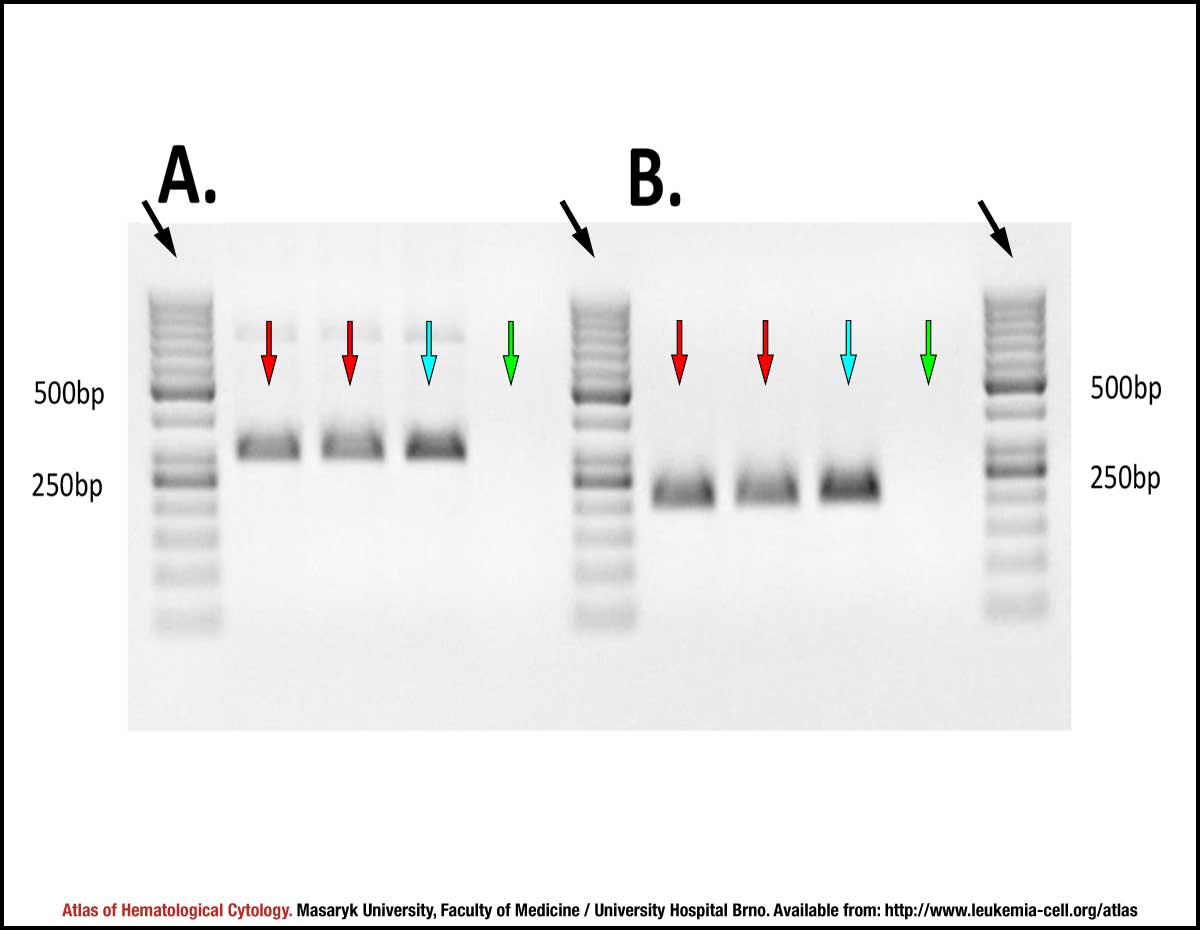 zoom picture
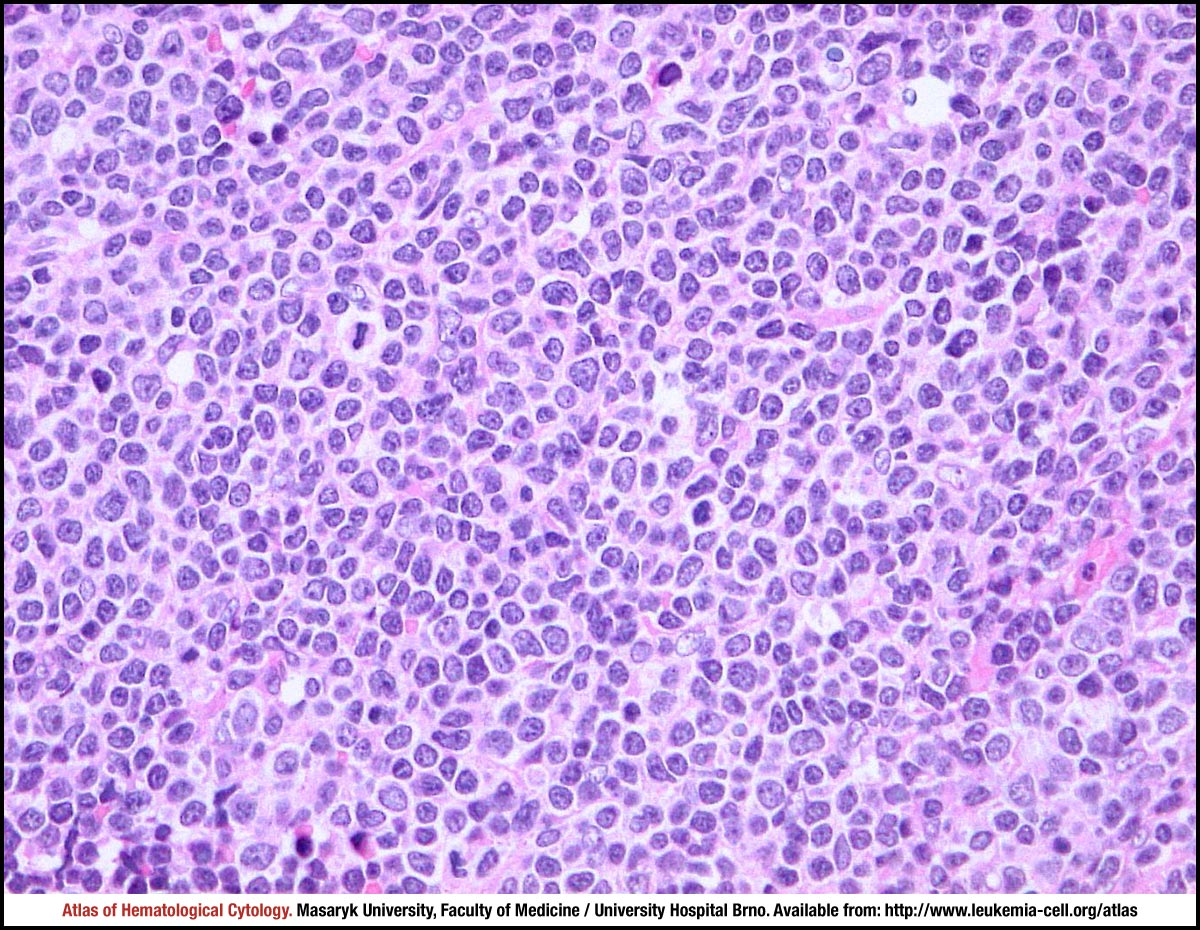 zoom picture