with flowcytometry, cytogenetic and molecular biology findings
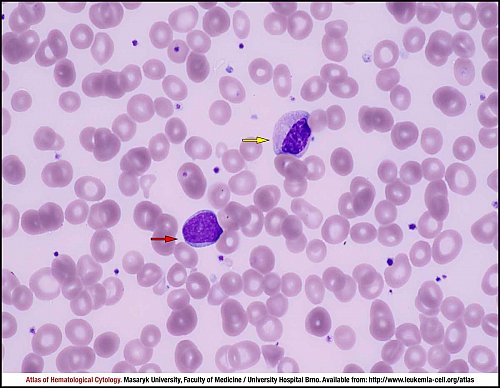
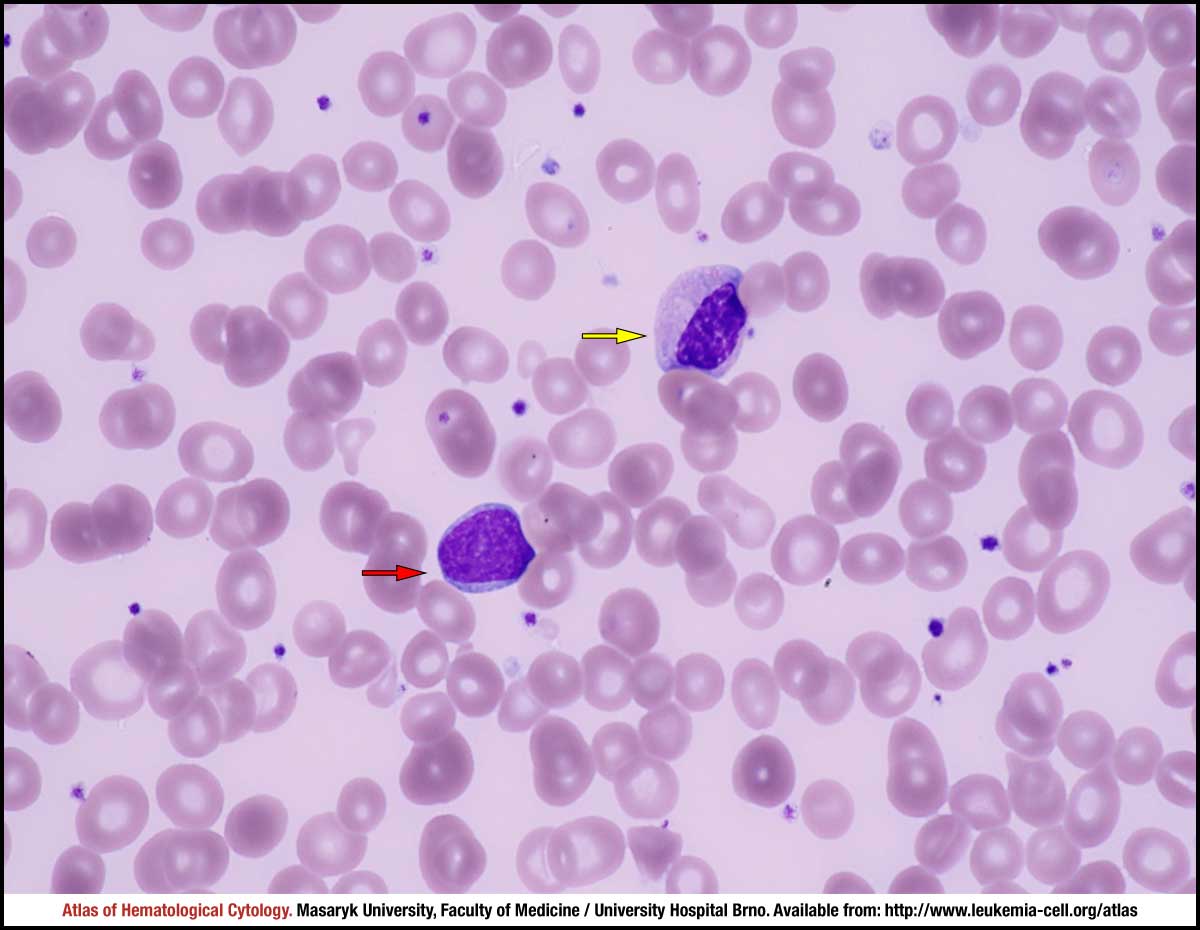
Peripheral blood smear: one myeloblast (red arrow) and one metamyelocyte (yellow arrow) indicate a left shift and the presence of excess blasts.
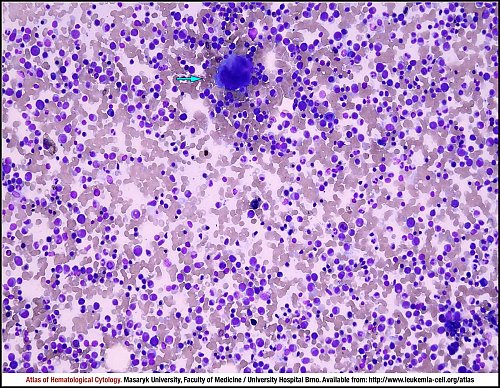
Marrow aspirate smear with an adequate cellularity and an almost proportional representation of haematopoietic cells. A megakaryocyte of a normal size and with a normally lobulated nucleus (cyan arrow) is shown in the upper middle part of the slide.
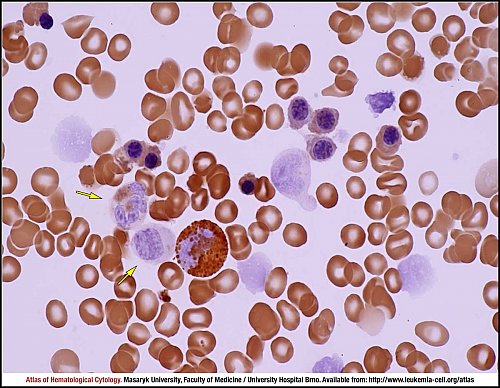
Marrow aspirate smear: three dysplastic erythroblasts (green arrows) with dehaemoglobinised cytoplasm; out of these, the cell on the left has a pyknotic nucleus. Many granulocytes (yellow arrows) are slightly macrocytic and with hypogranularity of cytoplasm. A promegakaryocyte is also shown in the image (black arrow).
Marrow aspirate smear: there are many hypogranular granulocytes which are slightly macrocytic. Erythroblasts with karyorrhexis (green arrows) and one erytroblast with an abnormal shape of nucleus (white arrow) are indicators of dyserythropoiesis.
Myeloperoxidase-stained marrow aspirate smear with two neutrophils with decreased numbers or lack of myeloperoxidase granules: this abnormality is an indicator of dysgranulopoiesis.
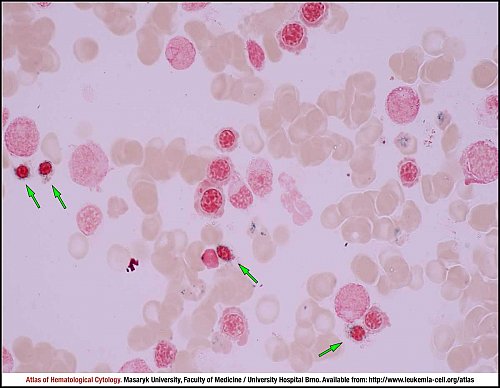
Iron-stained marrow aspirate smear with many ringed sideroblasts (green arrows), which are indicators of dyserythropoiesis.
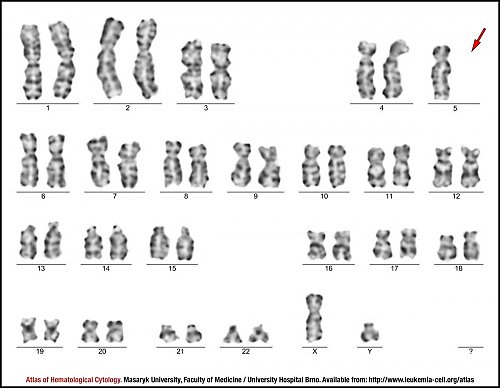
G-banded karyotype of a bone marrow metaphase cell with karyotype 45,XY,-5. The missing chromosome 5 is indicated by a red arrow.
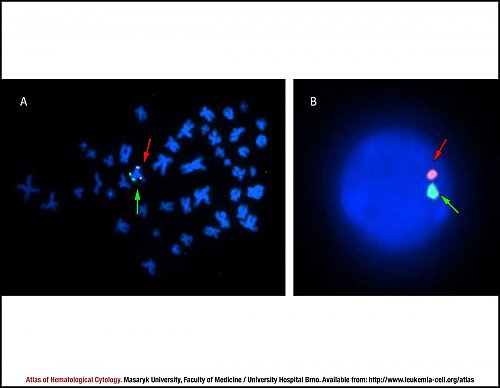
Fluorescence in situ hybridisation (FISH) of monosomy 5 performed on (A) metaphase chromosomes and (B) an interphase cell. The orange-labelled probe indicates the chromosomal region 5q31.2 (red arrows), whereas the green-labelled probe covers the region 5p15.2->p15.3 (green arrows). Only one orange signal and one green signal indicate monosomy 5 in metaphase chromosomes and in the interphase cell.
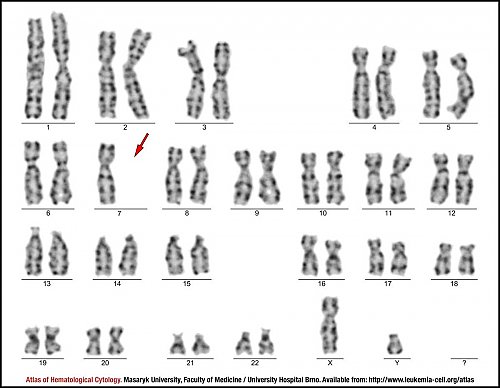
G-banded karyotype of a bone marrow metaphase cell with karyotype 45,XY,-7. The missing chromosome 7 is indicated by a red arrow.
Fluorescence in situ hybridisation (FISH) of monosomy 7 performed on (A, C) metaphase chromosomes and (B) an interphase cell. The orange-labelled probe indicates the chromosomal region 7q22 (red arrows), the green-labelled probe covers region 7q31 (green arrows) and the aqua-labelled probe hybridises to the centromeric region of chromosome 7 (blue arrows). One green signal, one orange signal and one aqua signal indicate monosomy 7 in metaphase chromosomes and in the interphase cell.
Atlas of Haematological Cytology [online]. 2016 [cit. 2026-7-11]. Available from WWW: http://www.leukemia-cell.org/atlas.
2026 CELL - Atlas of Haematological Cytology | site map
 zoom picture
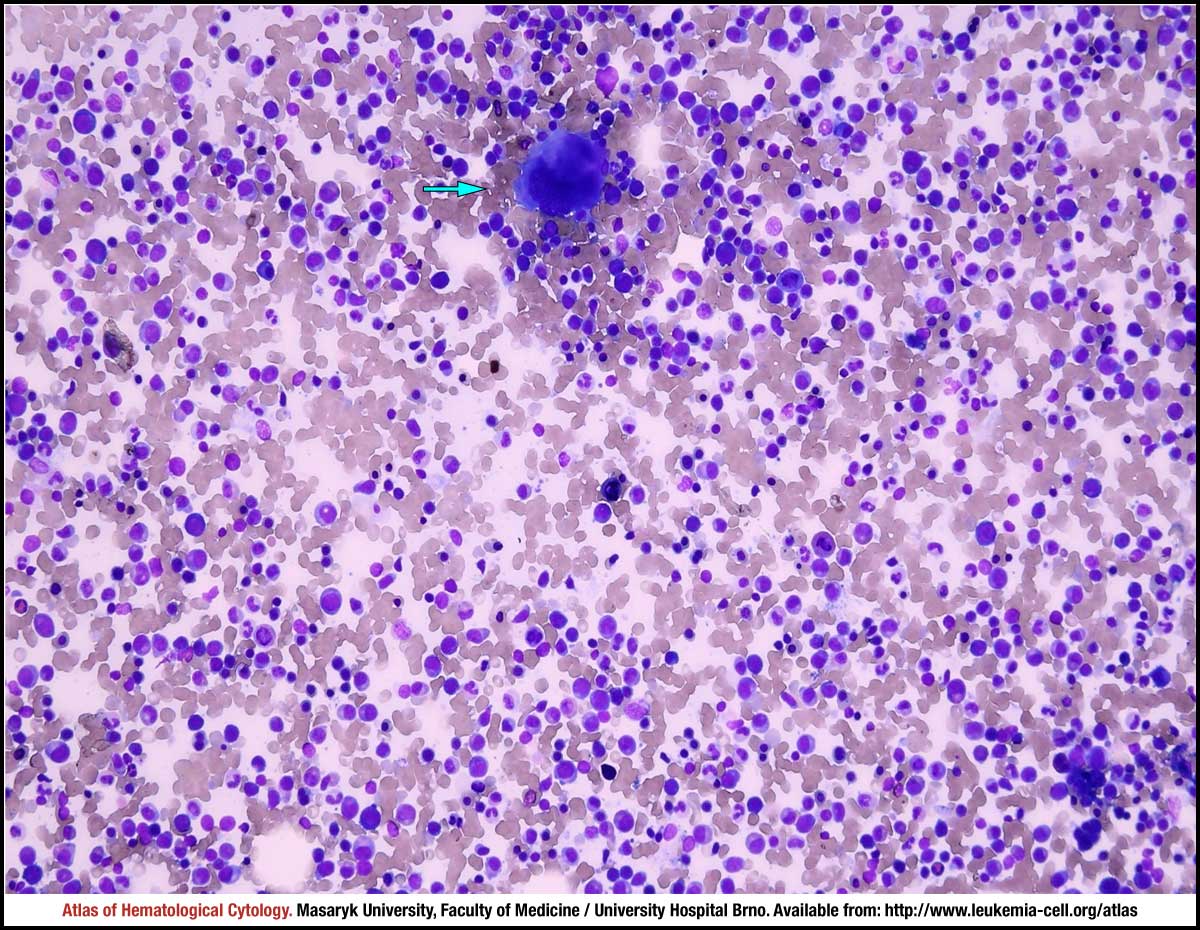 zoom picture
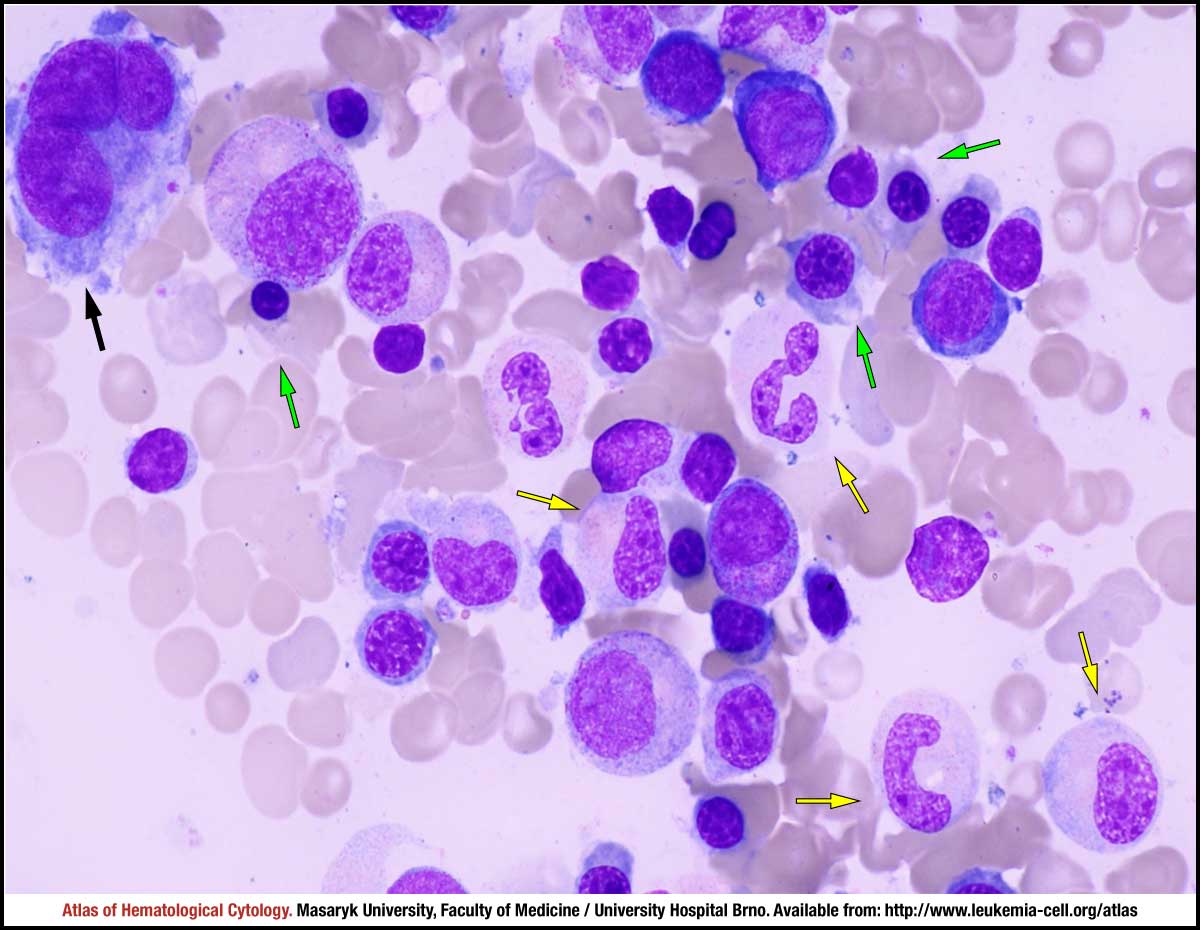 zoom picture
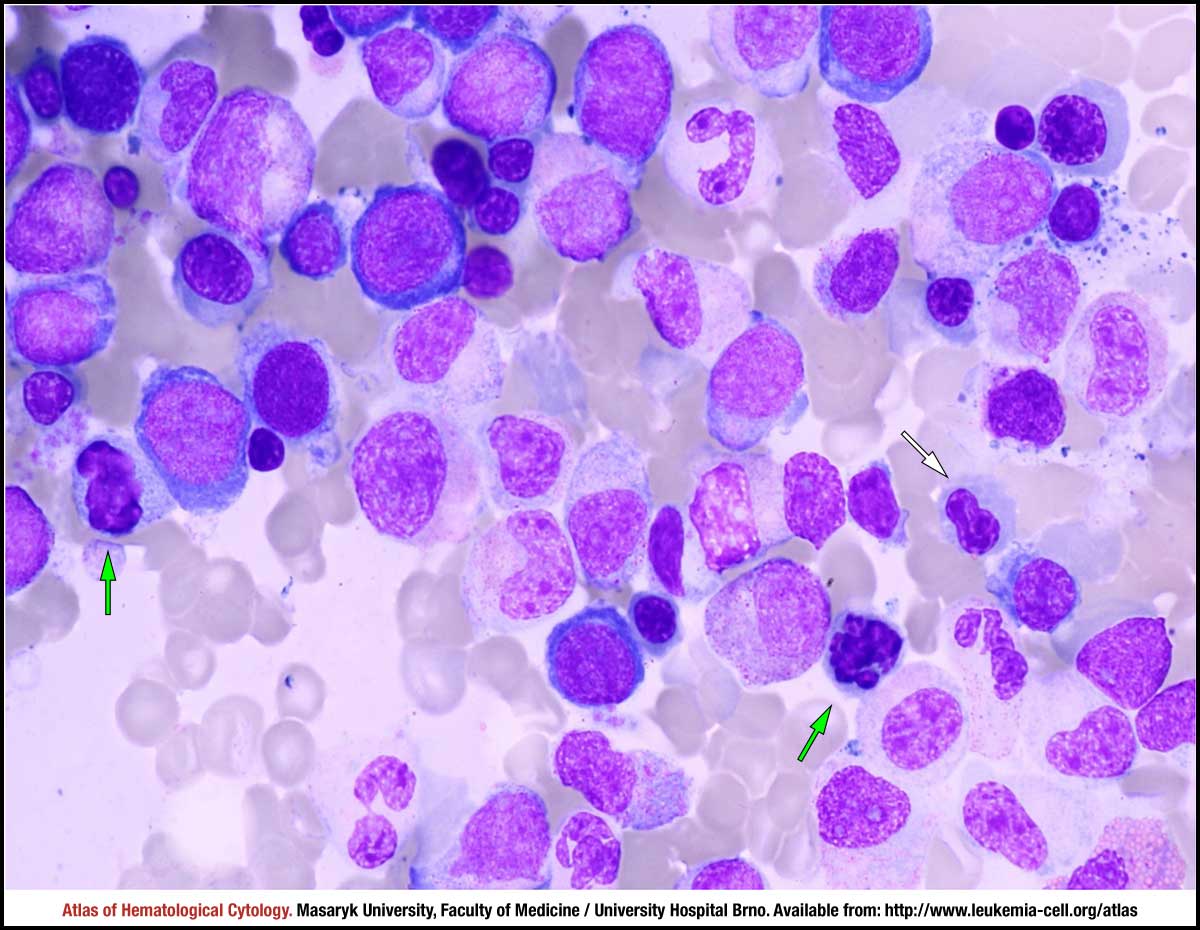 zoom picture
 zoom picture
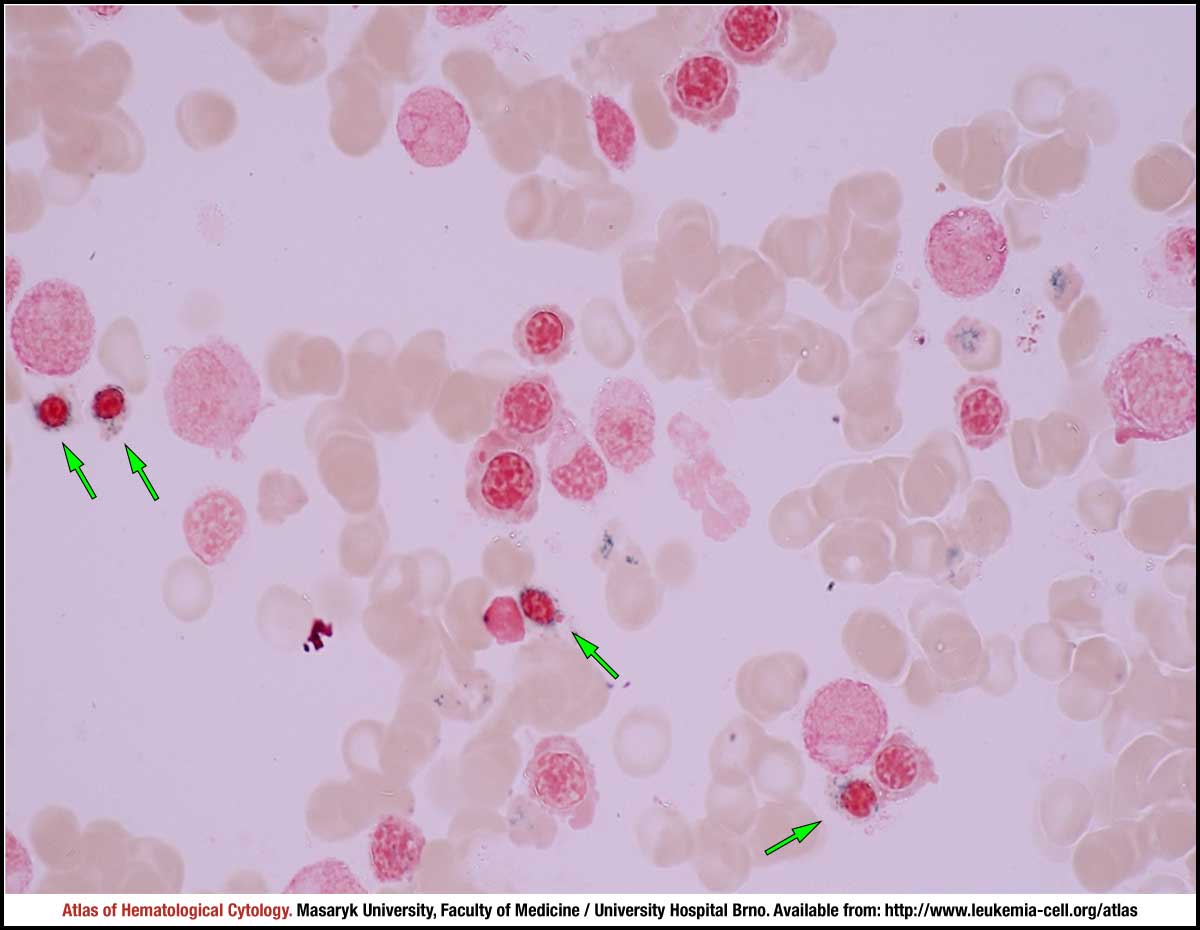 zoom picture
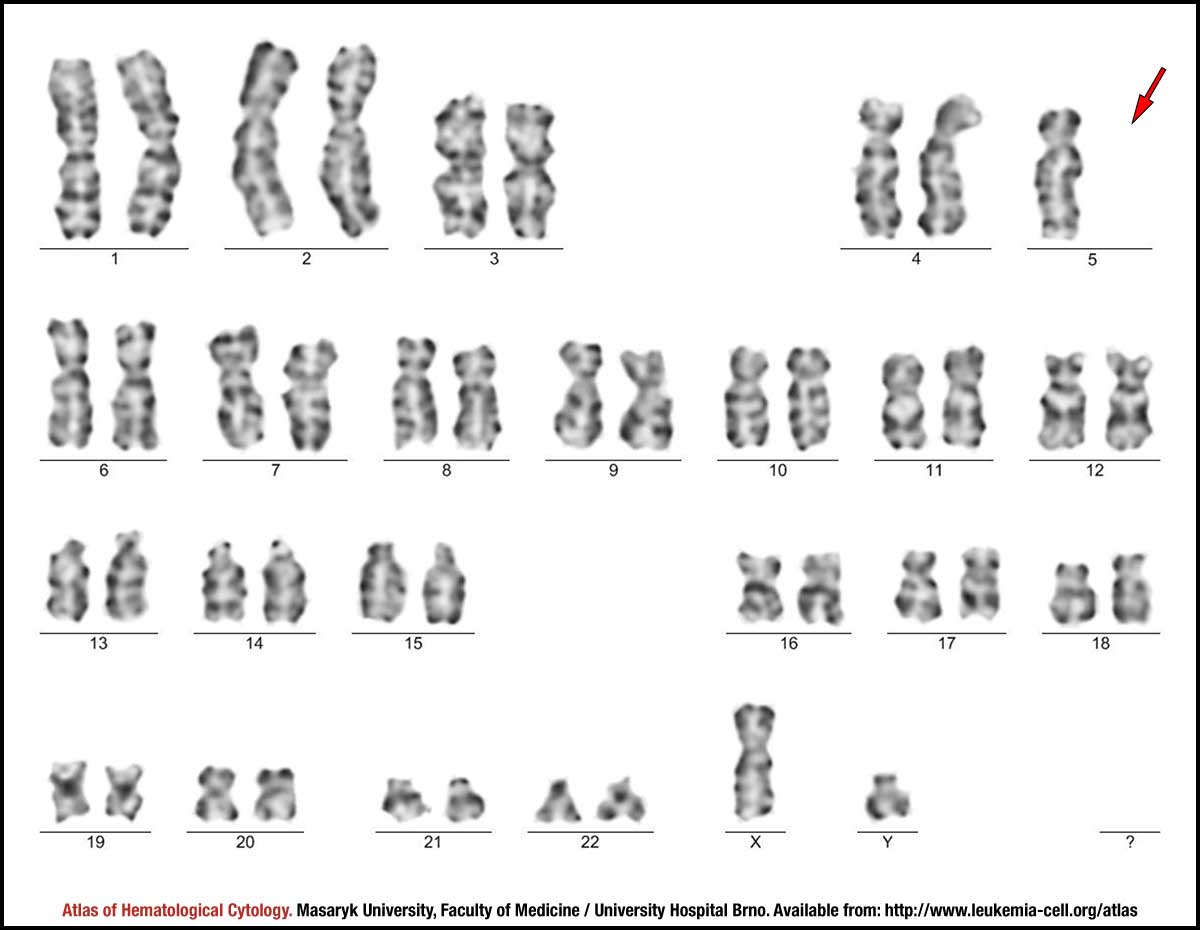 zoom picture
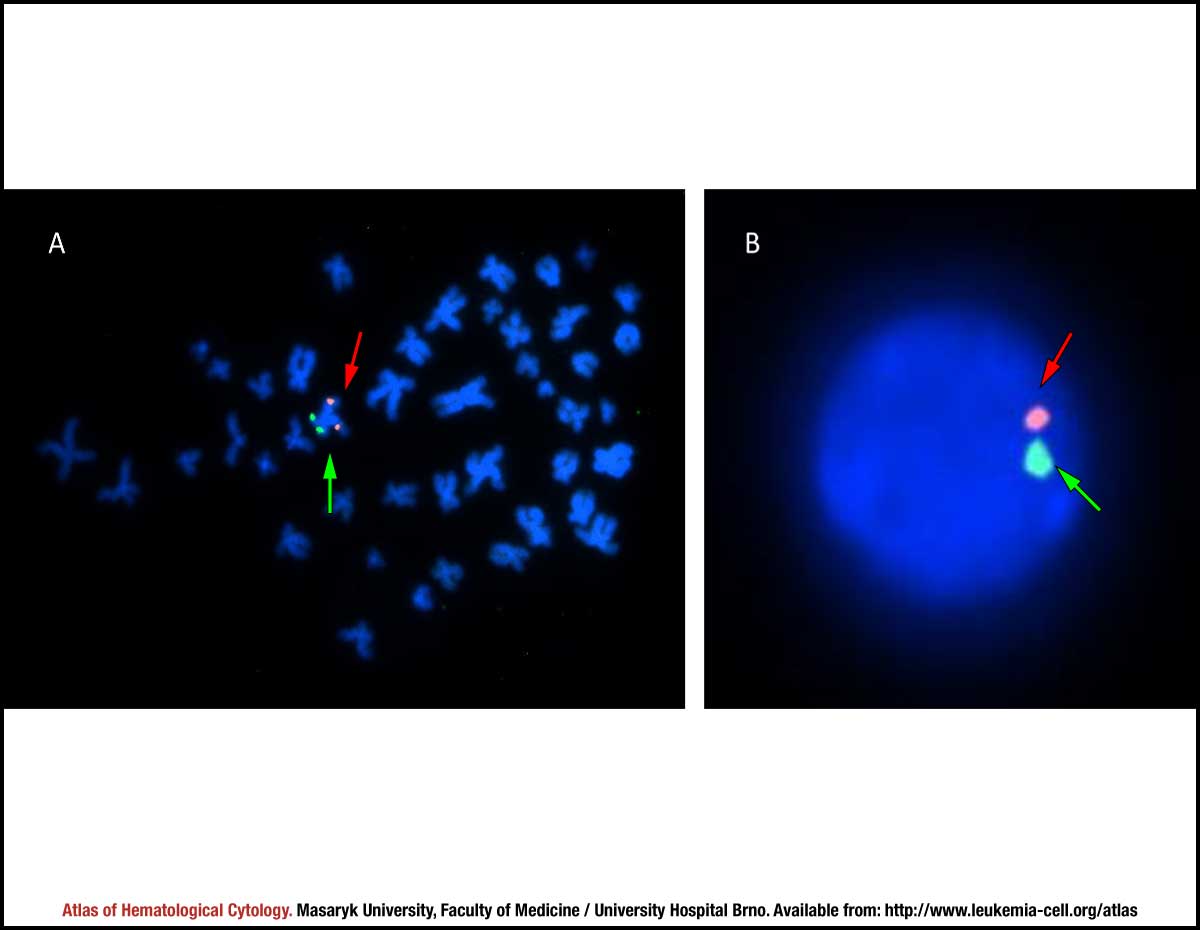 zoom picture
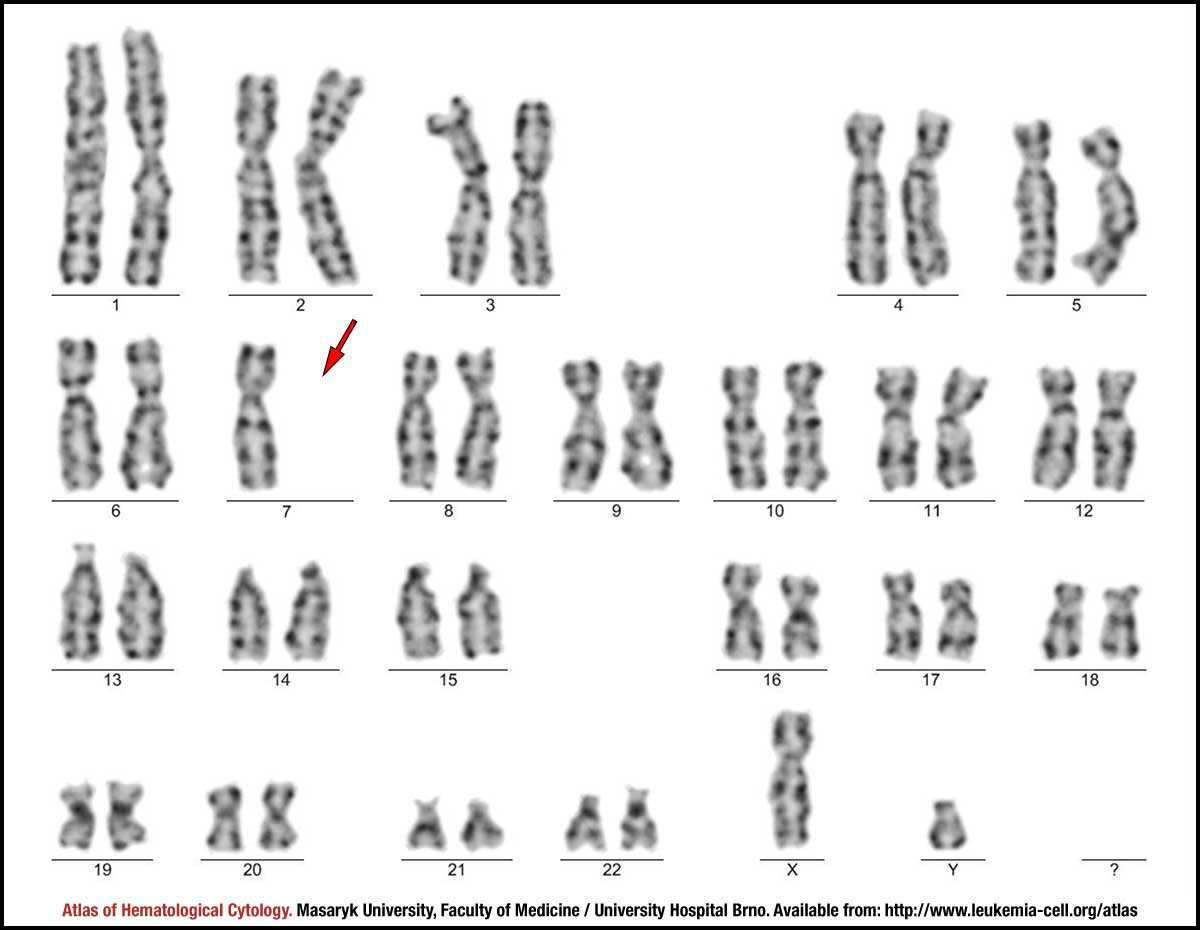 zoom picture
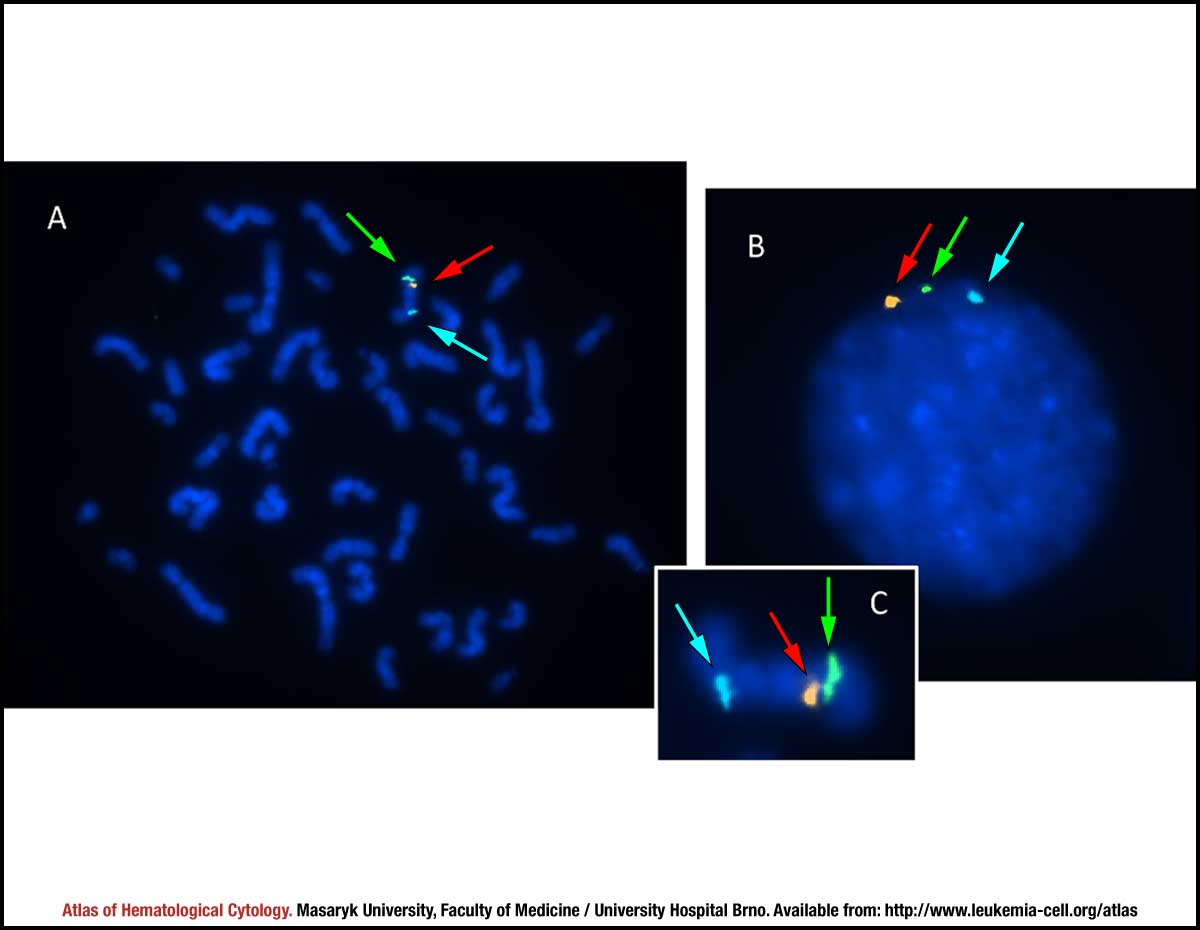 zoom picture