with flowcytometry, cytogenetic and molecular biology findings
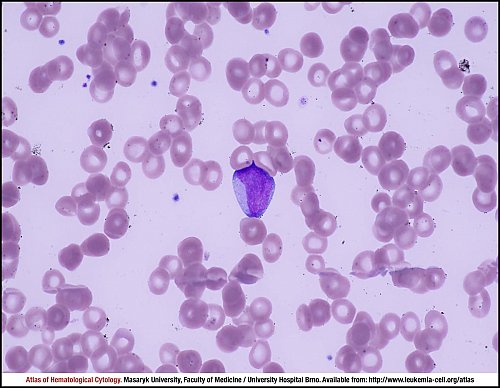
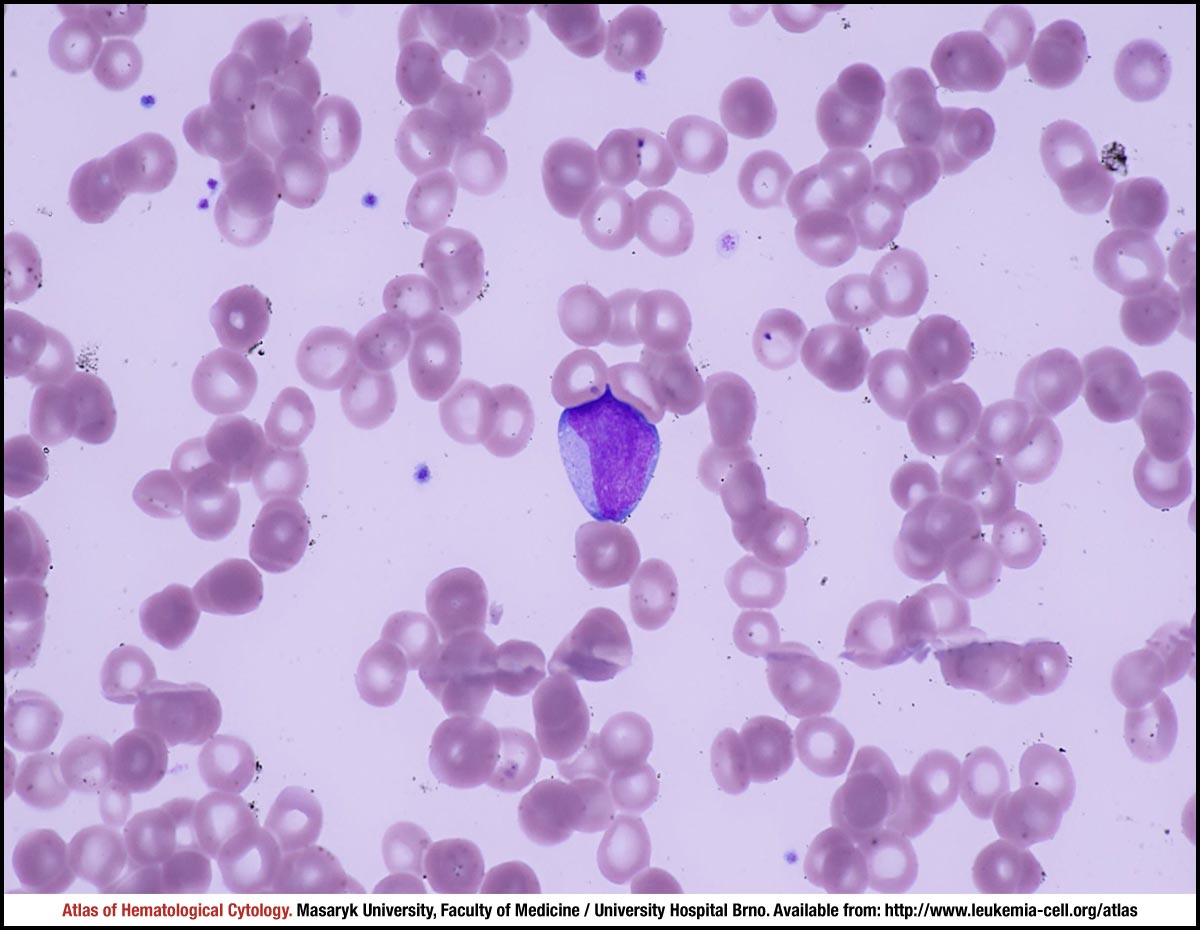
One myeloblast with slightly indented nucleus, fine chromatin, inconspicuous nucleolus, agranular cytoplasm and very fine vacuolation.
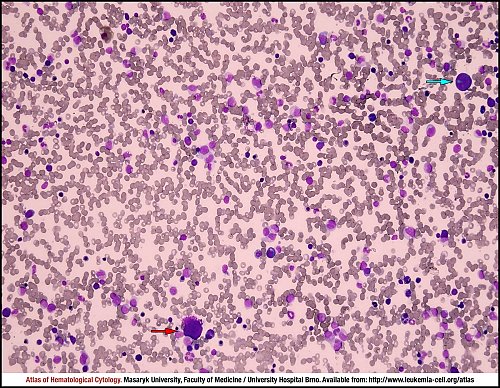
Marrow aspirate smear with an adequate cellularity and an almost proportional representation of haematopoietic cells. A less mature megakaryocyte is seen on the top right (cyan arrow). A bare nucleus of a megakaryocyte is marked by a red arrow.
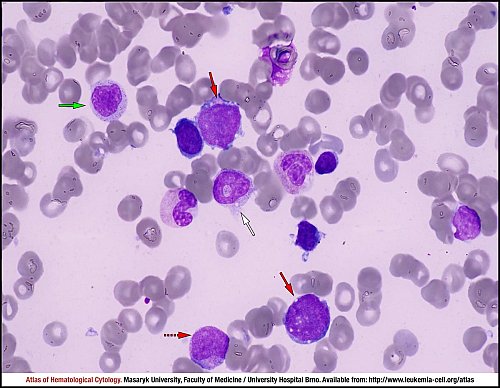
Four myeloblasts are marked by red arrows, the one on the very right has a slightly indented nucleus and contains granules. The solid white arrow marks an atypical promyelocyte with nuclear-cytoplasmic asynchrony, clustered granules and vacuoles, whereas the dotted white arrow marks a neutrophilic metamyelocyte. Solid yellow arrows mark three dysplastic erythroblasts with dehaemoglobinised cytoplasm and atypical nuclear shape; the one on the bottom is megaloblastoid and binucleate. Two erythroblasts in mitosis are marked by dotted yellow arrows.
Two myeloblasts about 18–20 μm in size (solid red arrows), with a high nuclear-cytoplasmic ratio, fine chromatin and more deeply basophilic cytoplasm containing granules. The myeloblast on the bottom (dotted red arrow) is slightly more mature – it contains granules. A dysplastic neutrophil – a band cell with a ring-shaped nucleus – is marked by a white arrow.
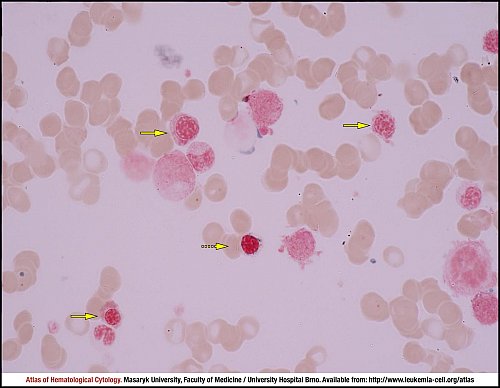
Two myeloblasts without granules are marked by solid red arrows, one myeloblast with a slightly indented nucleus and fine azurophilic granules is marked by a dotted red arrow. Solid yellow arrows mark three dysplastic erythroblasts with dehaemoglobinised cytoplasm, atypical nuclear shape (the left one) and a Howell–Jolly body (the bottom one). A trinucleate megaloblastoid erythroblast is marked by a dotted yellow arrow. Dysplastic neutrophils in different stages of maturation are also seen in the image (black arrows).
Myeloperoxidase-stained marrow aspirate smear with many positive neutrophils. Three myeloblasts are marked by red arrows: the left one without granules, the middle one containing fine granules and the right one containing granules and a short Auer rod.
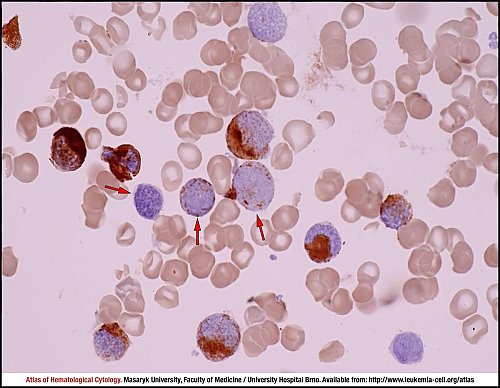
Iron-stained marrow aspirate smear: three erythroblasts (not containing siderotic granules, solid yellow arrows) and one ring sideroblast (dotted yellow arrow).
G-banded karyotype of a bone marrow metaphase cell showing 46,XX,del(7)(q22q34). The deleted chromosome 7 is indicated by a red arrow.
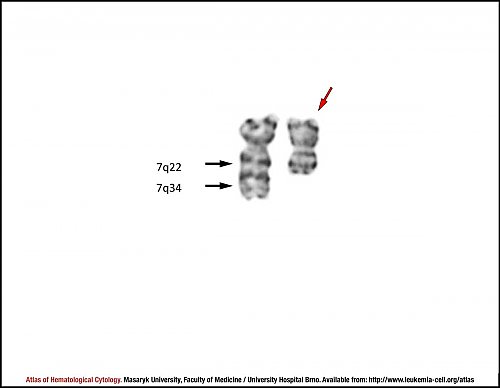
G-banded partial karyotype demonstrating a deletion of chromosome 7 (red arrow). Breaks of interstitial deletion 7q22->7q34 are indicated by black arrows.
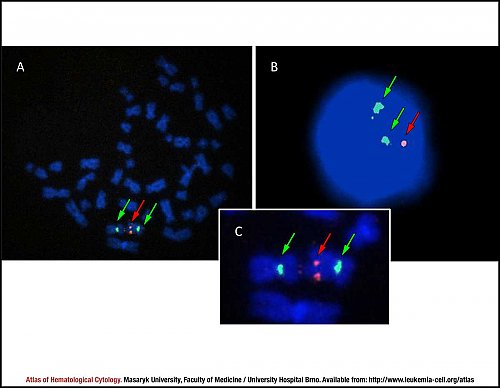
Fluorescence in situ hybridisation (FISH) of the 7q31 deletion performed on (A,C) metaphase chromosomes and (B) an interphase cell. The orange-labelled probe indicates the chromosomal region 7q31 (red arrows), whereas the green-labelled probe indicates the centromeric region of chromosome 7 (green arrows). The presence of one orange signal confirms the deletion 7q31 in metaphase chromosomes and in the interphase cell.
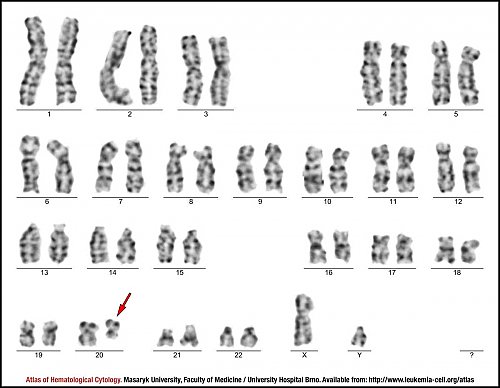
G-banded male karyotype of bone marrow metaphase cell showing 46,XY,del(20)(q11.2). The deleted chromosome 20 is indicated by a red arrow.
G-banded partial karyotype demonstrating a deletion of chromosome 20 (red arrow). Breakpoint of terminal deletion 20q11.2 is indicated by a black arrow.
Fluorescence in situ hybridisation (FISH) of the deletion 20q12 performed on (A,C) metaphase chromosomes and (B) an interphase cell. The orange-labelled probe indicates the chromosomal region 20q11 (red arrows) and the green-labelled probe indicates region 20q12 (green arrows). The presence of two orange signals and one green signal confirms the deletion 20q12 in metaphase chromosomes and in the interphase cell.
G-banded male karyotype 47,XY,+8. The trisomy of chromosome 8 is indicated by a red arrow.
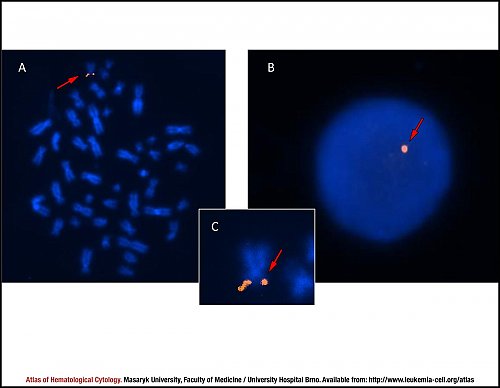
Fluorescence in situ hybridisation (FISH) with a centromeric probe for chromosome 8 on (A) metaphase chromosomes and (B) an interphase cell. Three green signals (red arrows) indicate the trisomy of chromosome 8.
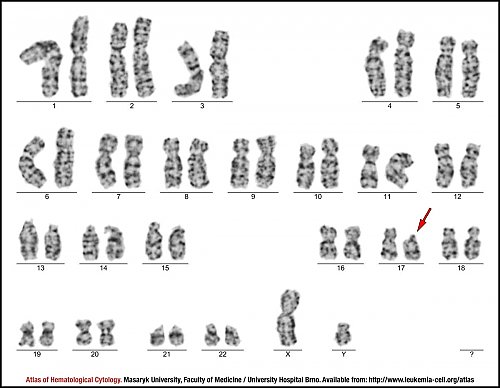
G-banded male karyotype of a bone marrow metaphase cell reveals the karyotype 46,XY,del(17)(p11.2). The deleted chromosome 17 is indicated by a red arrow.
G-banded partial karyotype demonstrating a deletion of chromosome 17 (the deleted chromosome 17 is indicated by a red arrow). A terminal deletion of the short (p) arm on chromosome 17 results in the loss of region containing the gene TP53 (region 17p13.1 containing the gene TP53 is indicated by a black arrow on the normal chromosome homologue).
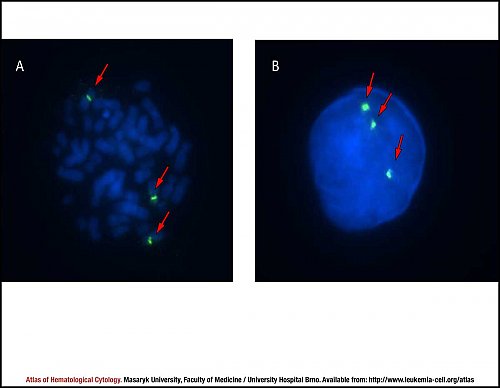
Fluorescence in situ hybridisation (FISH) performed on metaphase chromosomes (A,C) and an interphase cell (B) confirms a deletion on the short (p) arm of chromosome 17. The orange-labelled probe indicates a TP53 locus in the region 17p13.1 (indicated by red arrows). The presence of only one orange signal on chromosomes and an interphase cell (A, B, C) confirms the deletion of the TP53 gene.
Atlas of Haematological Cytology [online]. 2016 [cit. 2026-7-11]. Available from WWW: http://www.leukemia-cell.org/atlas.
2026 CELL - Atlas of Haematological Cytology | site map
 zoom picture
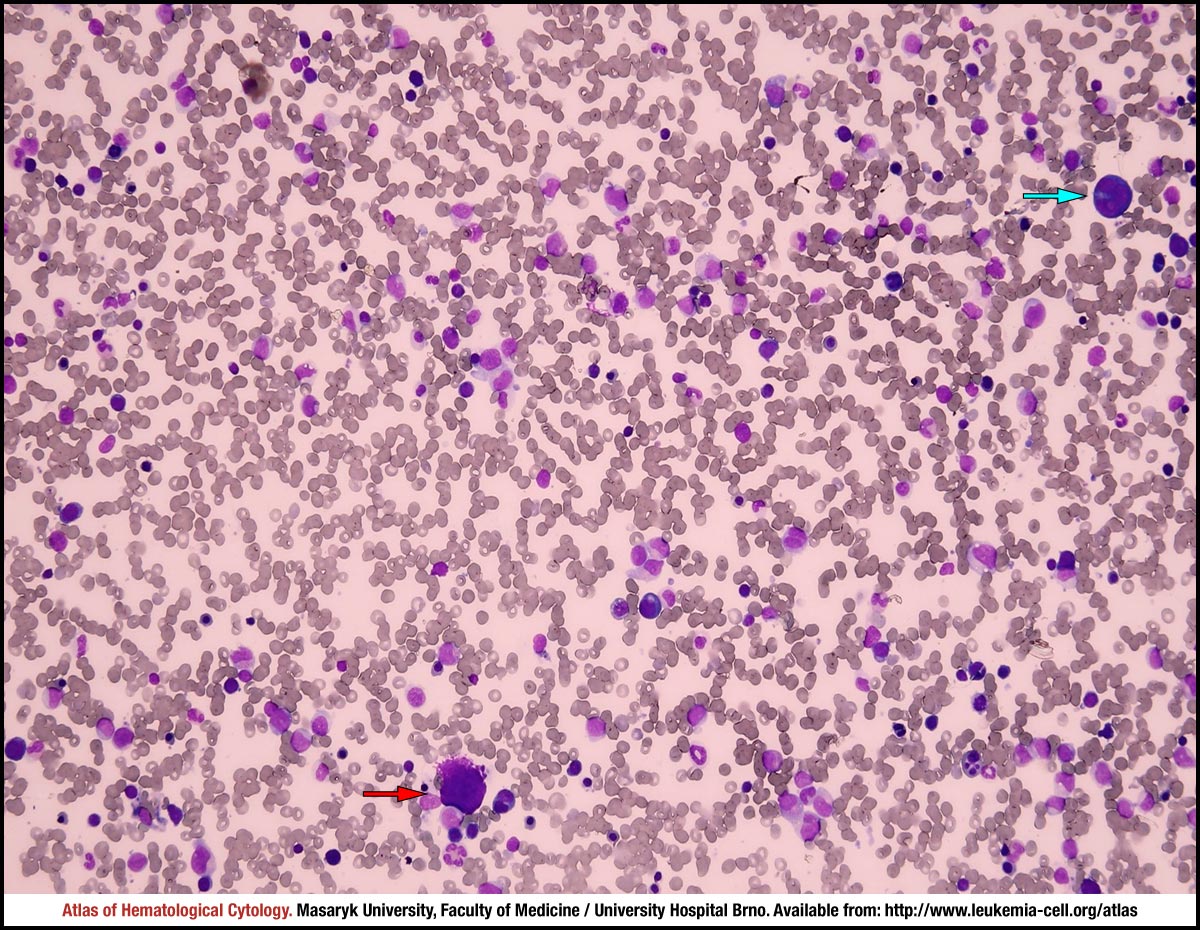 zoom picture
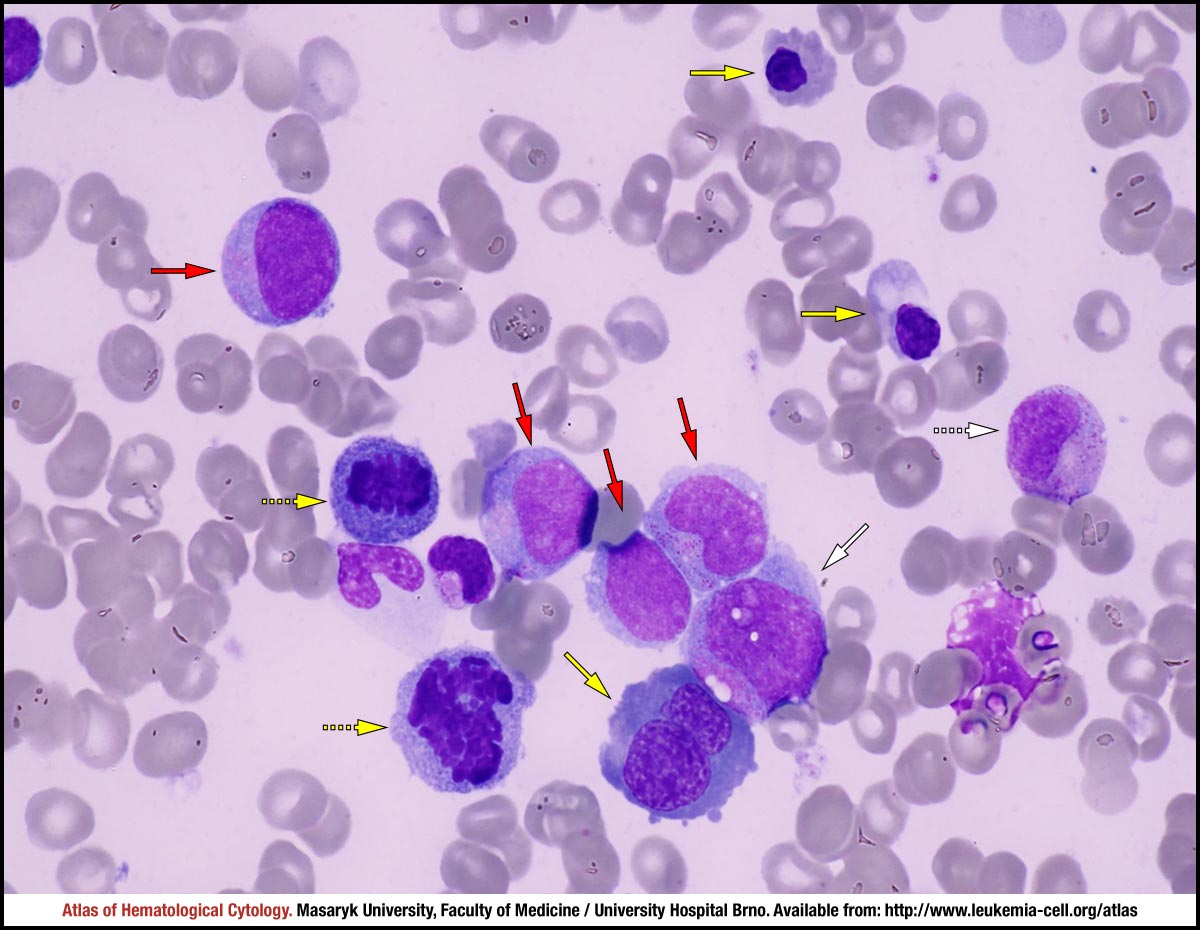 zoom picture
 zoom picture
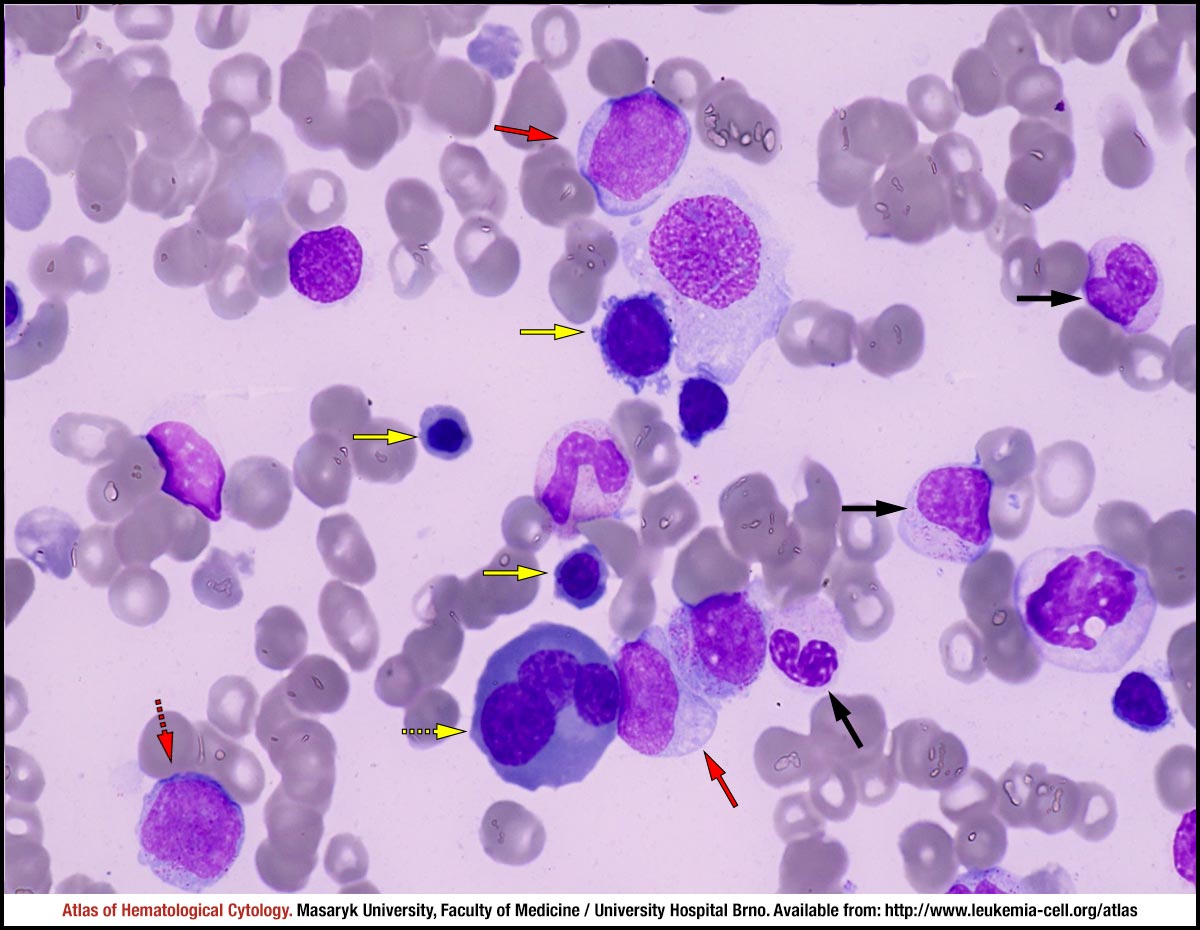 zoom picture
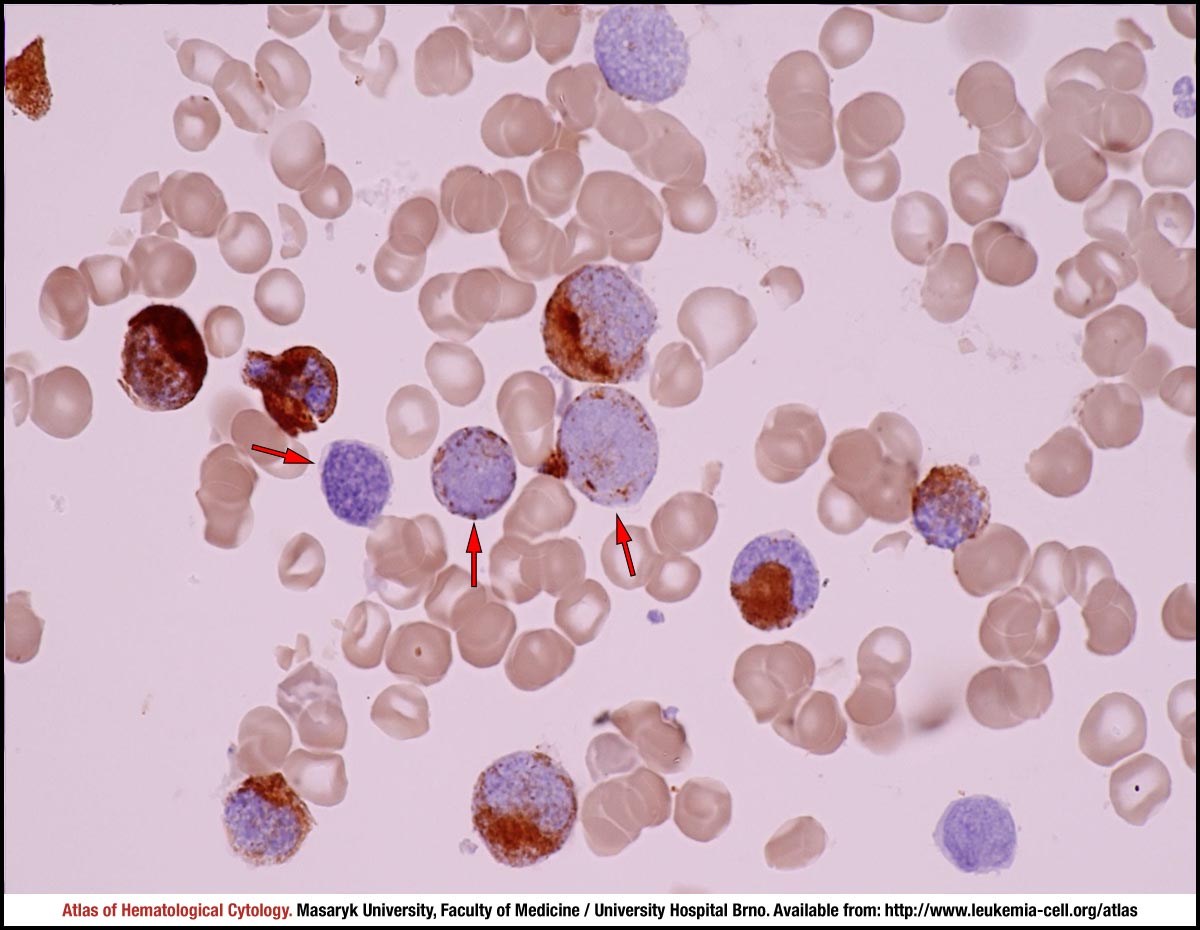 zoom picture
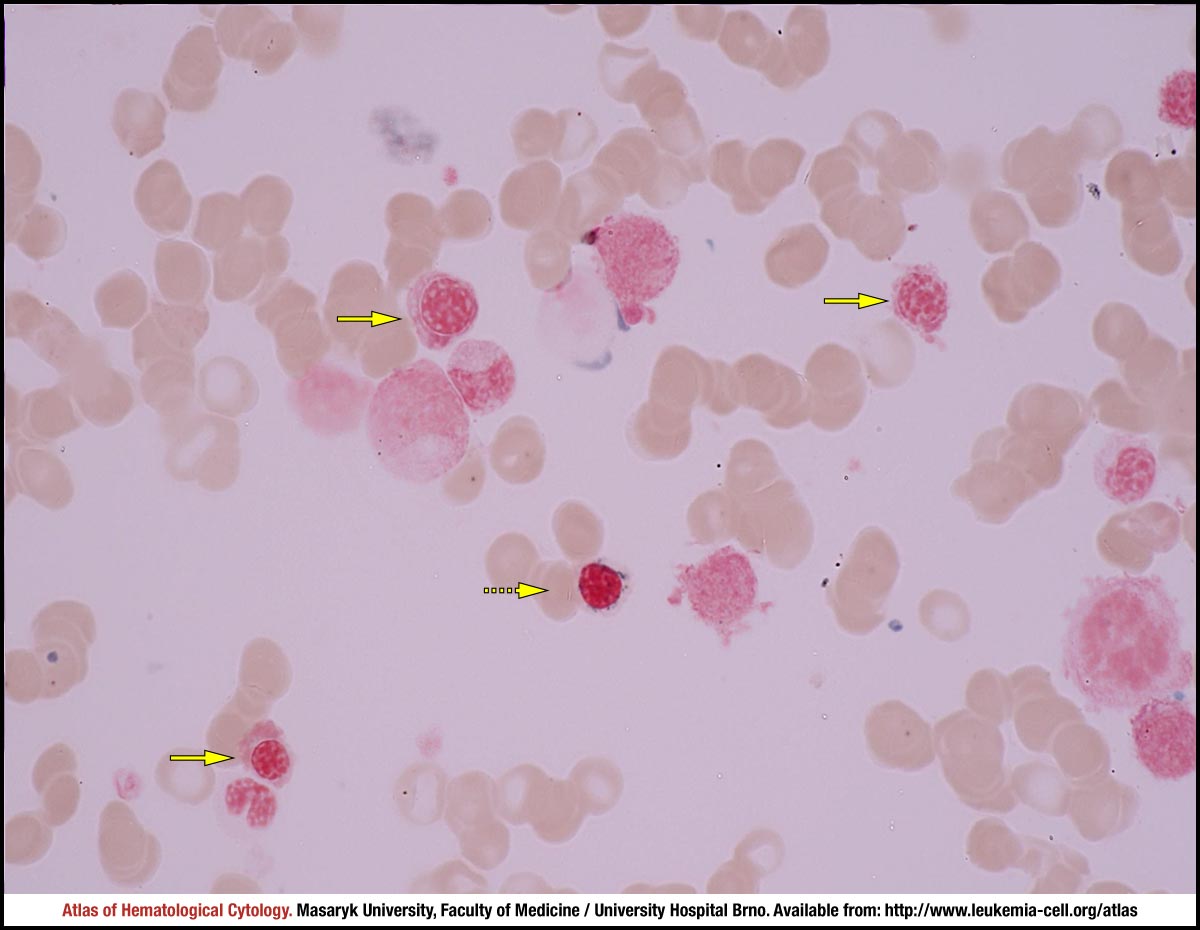 zoom picture
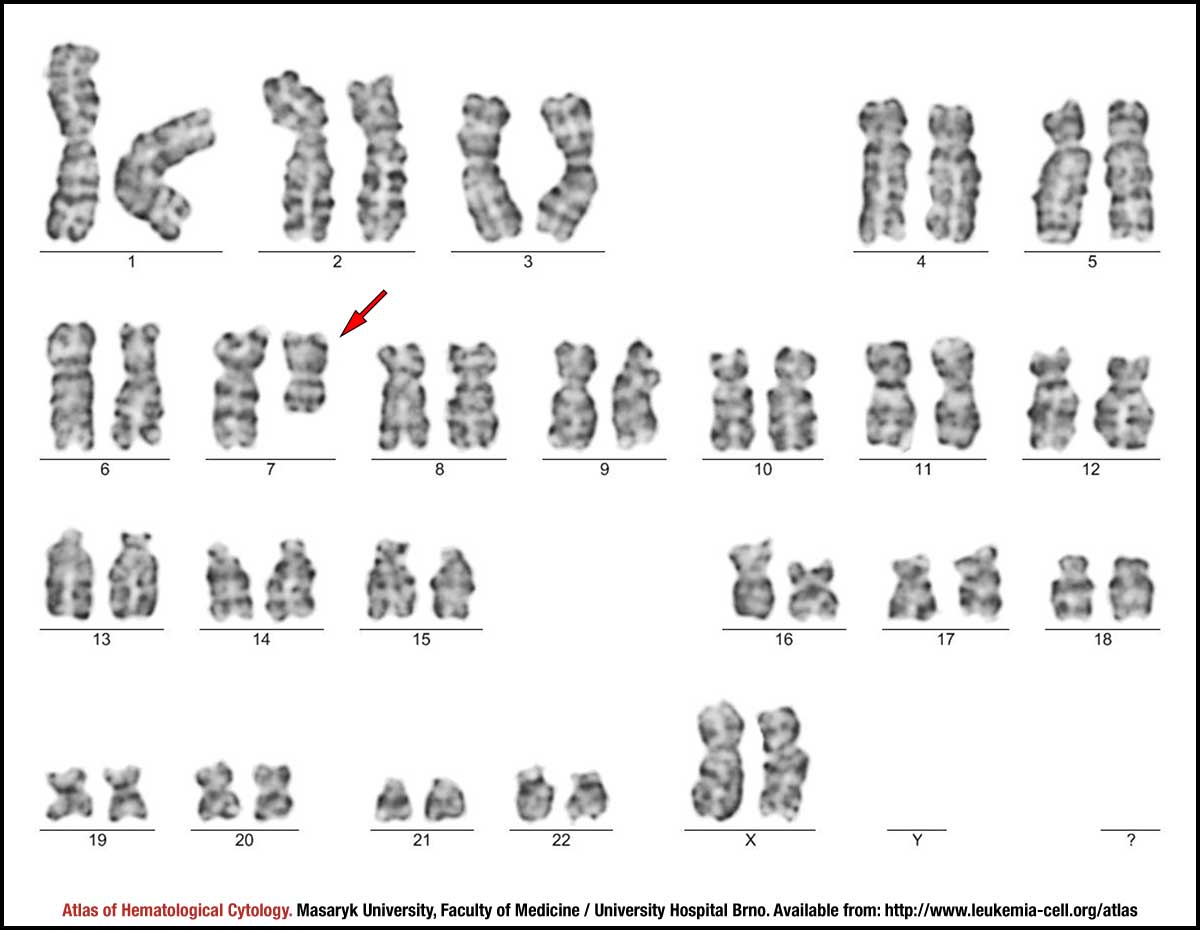 zoom picture
 zoom picture
 zoom picture
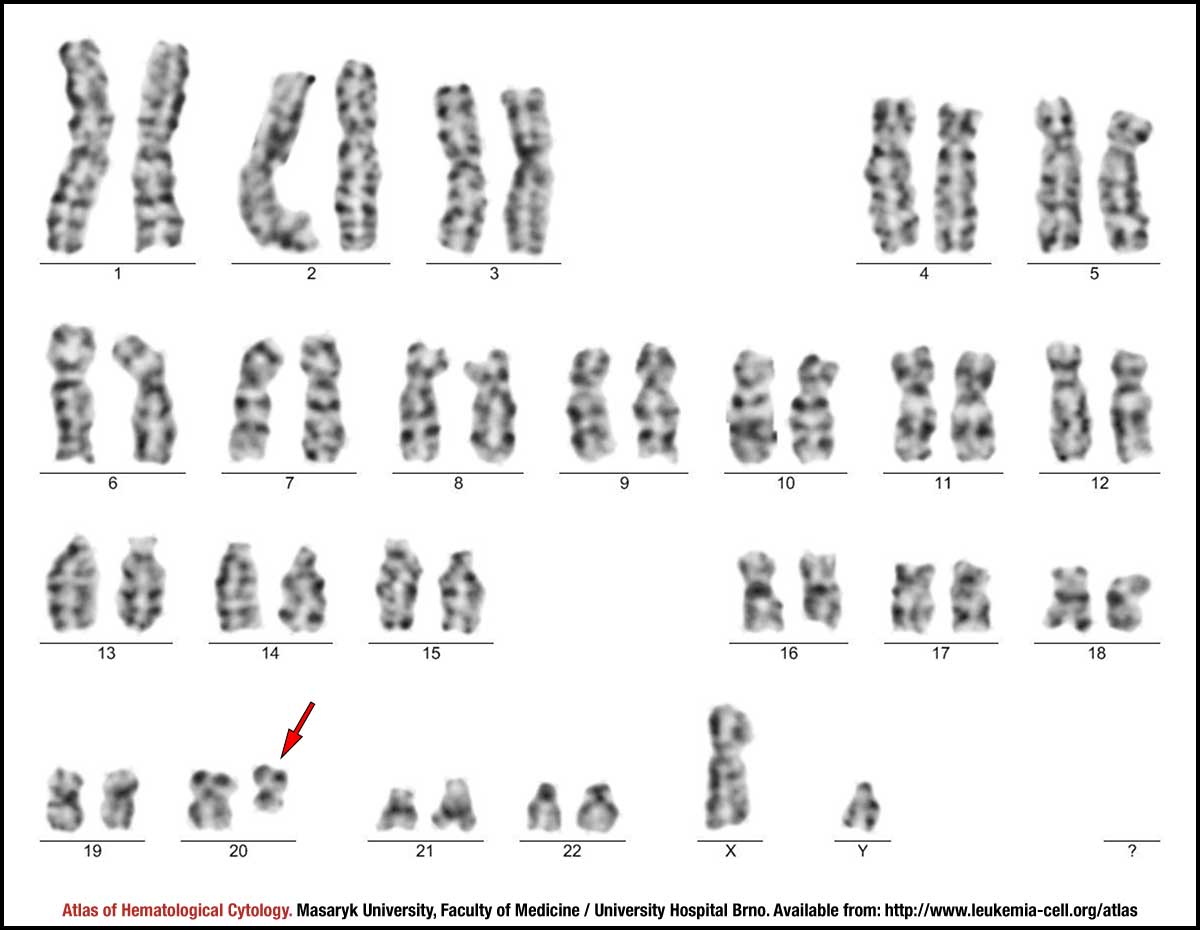 zoom picture
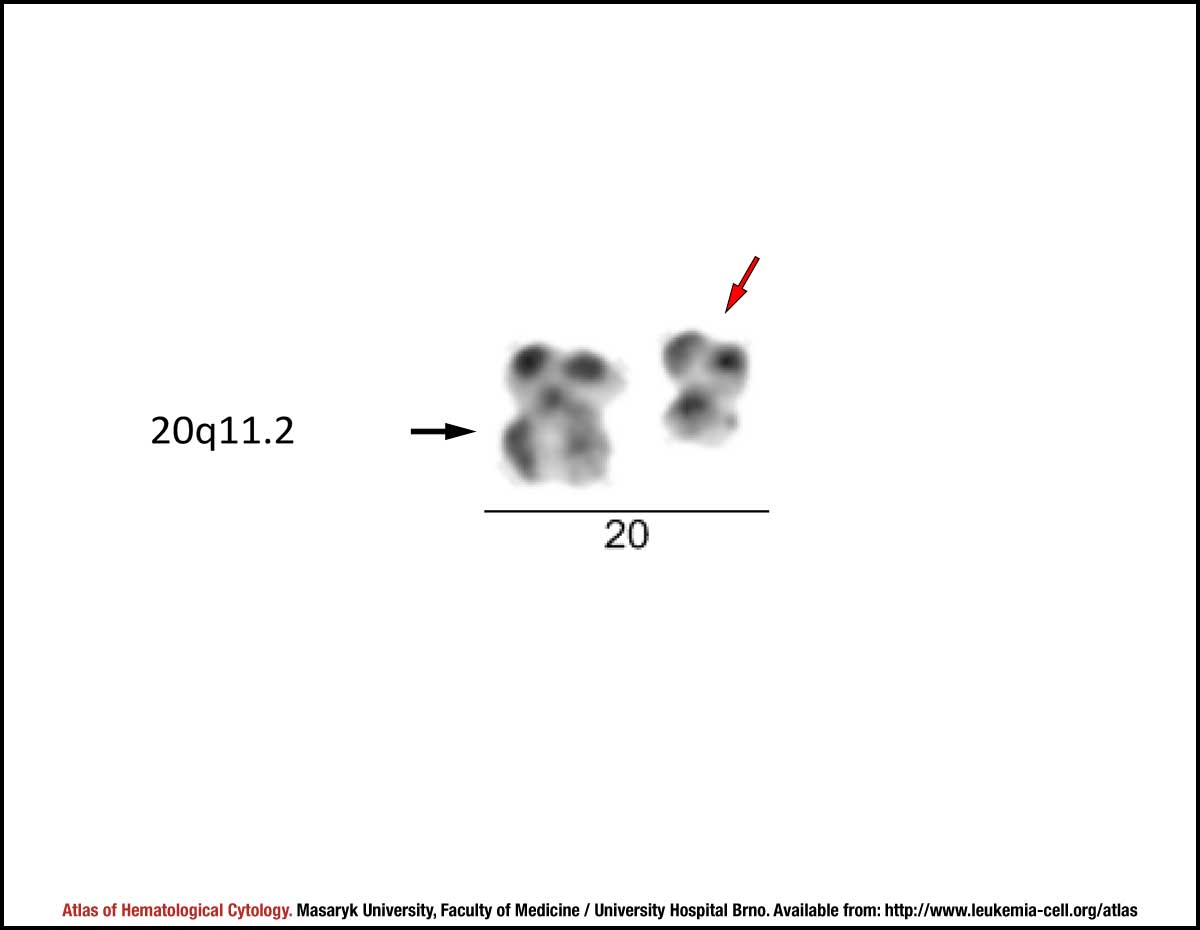 zoom picture
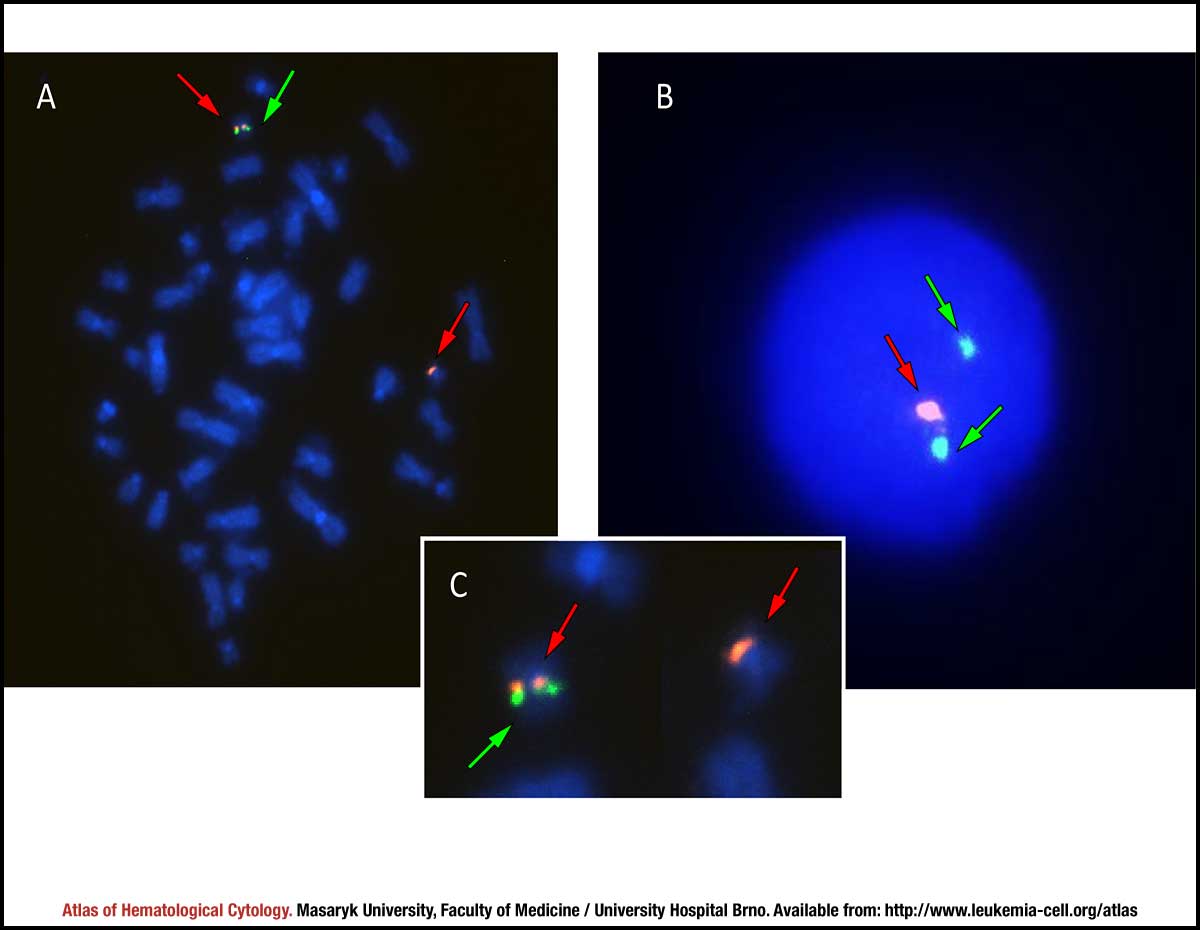 zoom picture
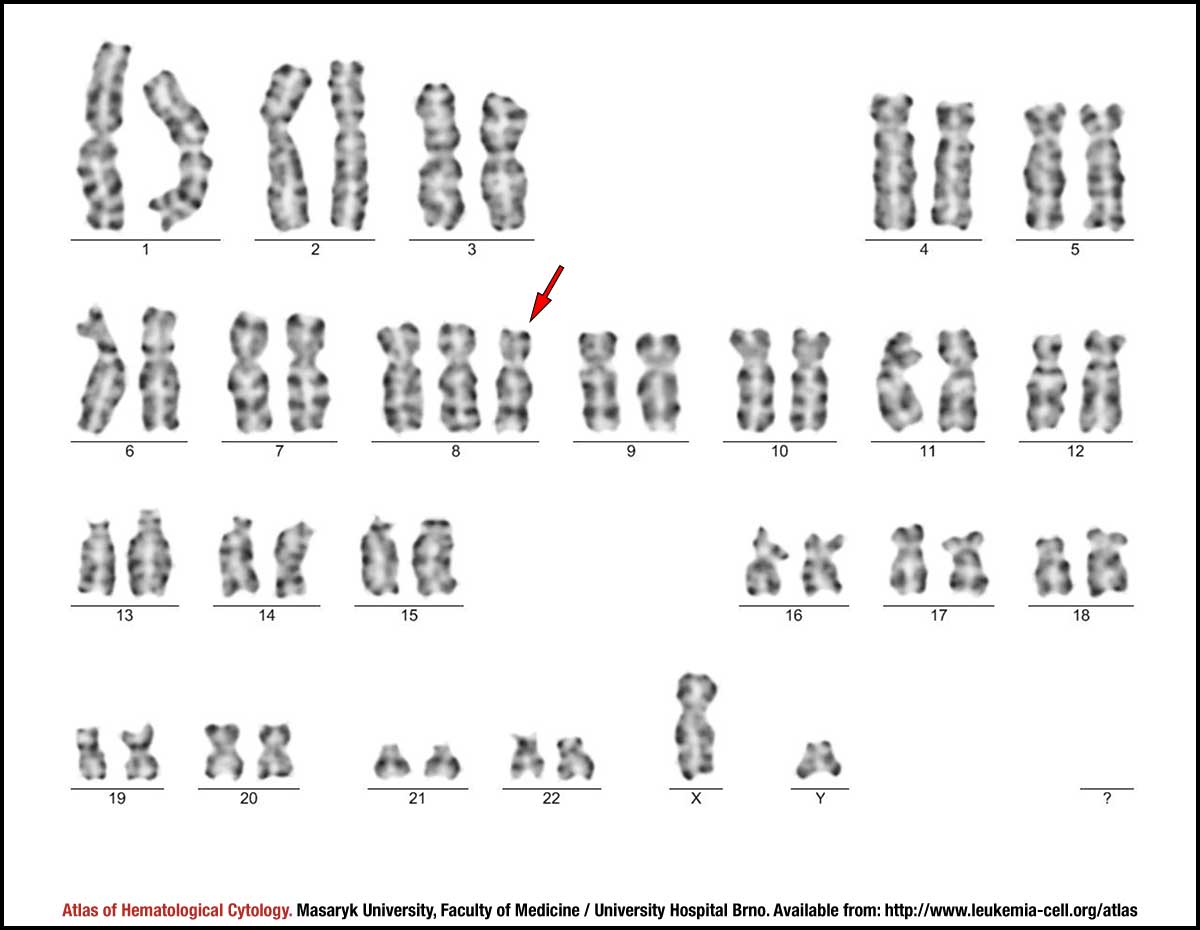 zoom picture
 zoom picture
 zoom picture
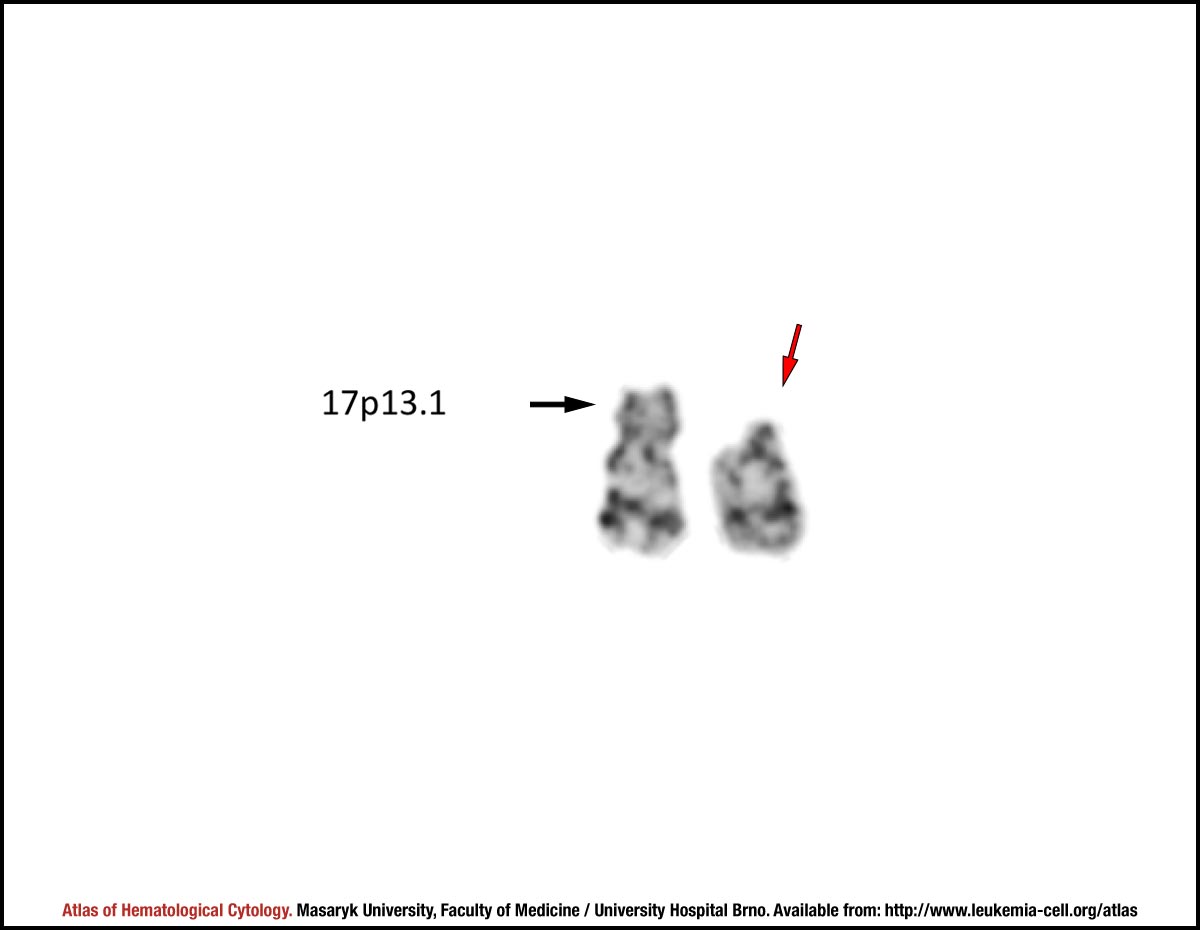 zoom picture
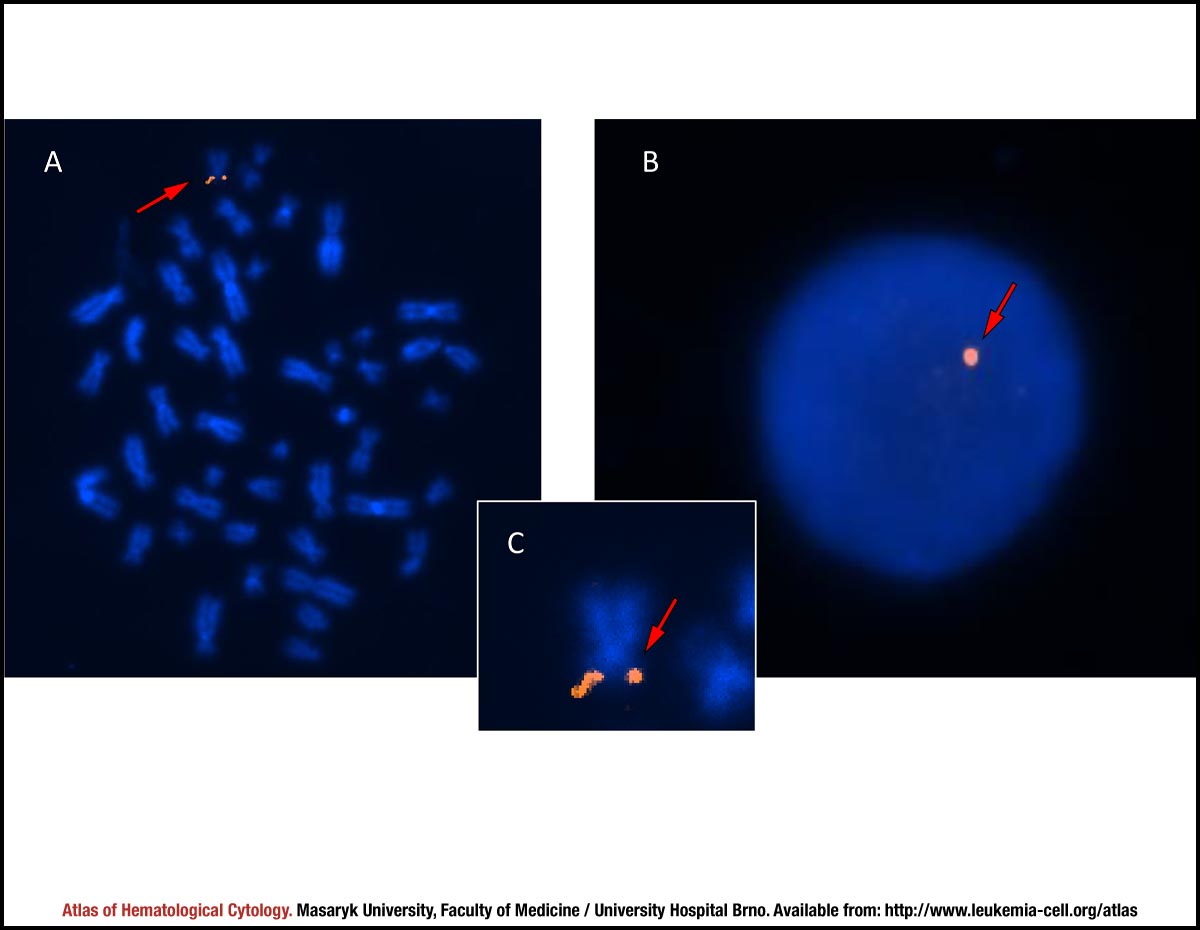 zoom picture