with flowcytometry, cytogenetic and molecular biology findings
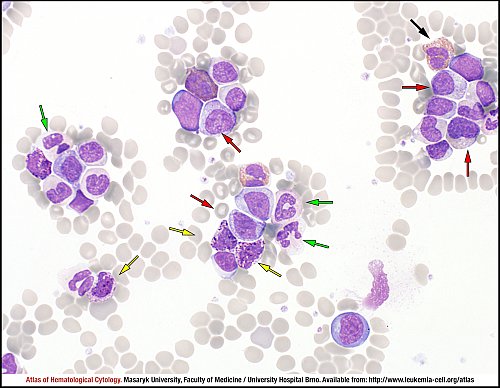
Peripheral blood smear shows leucocytosis due to neutrophils in different stages of maturation with two peaks in differential blood count – myelocytes (red arrows) and segmented neutrophils (green arrows). Basophil count is almost invariably increased (yellow arrows) and absolute eosinophil (black arrows) count is increased in the vast majority of patients.
Bone marrow is hypercellular with an increase in granulocytes and their precursors. The myeloid:erythroid ratio is greater than 10:1 and there is a low number of erythroid precursors (white arrows). All stages of granulocytic maturation are increased, the pattern is the same as in peripheral blood: two peaks in the percentage of myelocytes and of segmented neutrophils.
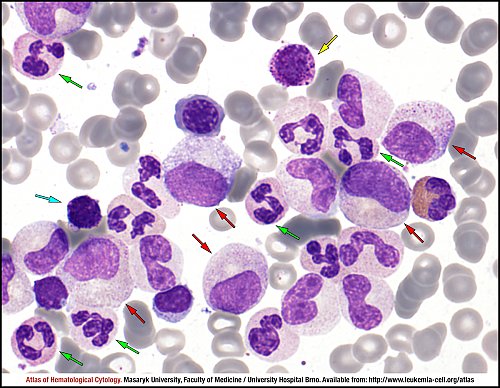
Granulocytic lineage is increased in bone marrow, with normal cellular maturation. Segmented neutrophils (green arrows) and myelocytes (red arrows) are the most frequent cells. Both immature basophils (yellow arrow) and mature basophils (blue arrow) are present.
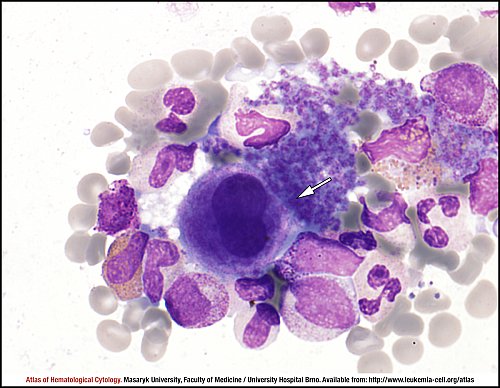
Megakaryocytes in bone marrow in CML are rather small (white arrow) and hypolobulated, but micromegakaryocytes, as seen in myelodysplastic syndrome, are not usually a feature of chronic phase CML.
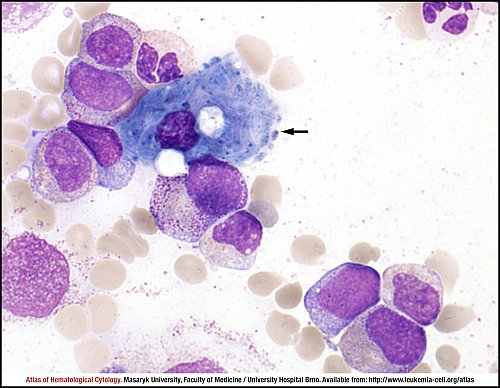
Storage cells are also frequently found in bone marrow. In this case (black arrow), the cell has characteristics intermediate between those of pseudo-Gaucher cell and sea-blue histiocyte.
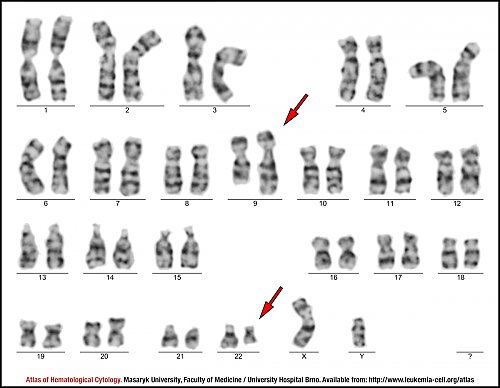
G-banded karyotype of bone marrow metaphase cell in CML patient reveals karyotype 46,XY,t(9;22)(q34;q11.2). Reciprocal translocation t(9;22)(q34;q11.2) that results in the Philadelphia (Ph) chromosome [der(22q)] is indicated by red arrows.
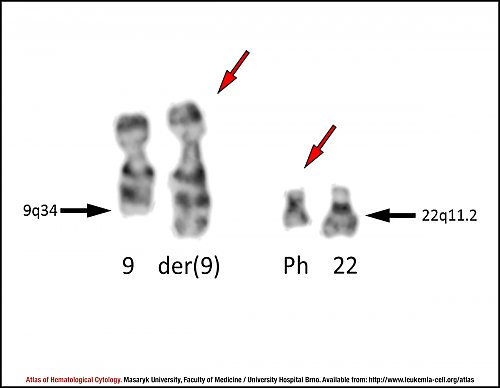
G-banded partial karyotype demonstrating translocation t(9;22)(q34;q11.2). Red arrows indicate derivative chromosomes 9 and 22. Breakpoint sites are indicated by black arrows on normal chromosome homologues. The translocation results in a shorter chromosome 22 [der(22q)] called the Philadelphia (Ph) chromosome and a slightly longer chromosome 9 [der(9)].
Fluorescence in situ hybridisation (FISH) of the BCR-ABL1 fusion was performed on interphase cells and chromosomes (a dual-colour, dual-fusion FISH probe was used). The white arrow indicates the Philadelphia (Ph) chromosome with BCR-ABL1 fusion (red-green signal). The red arrow indicates a signal for the ABL1 gene located on a normal 9q34, whereas the green arrow indicates a signal for the BCR gene located on a normal 22q11.2. The yellow arrow indicates a fusion (red-green) signal on a derivative 9q34.
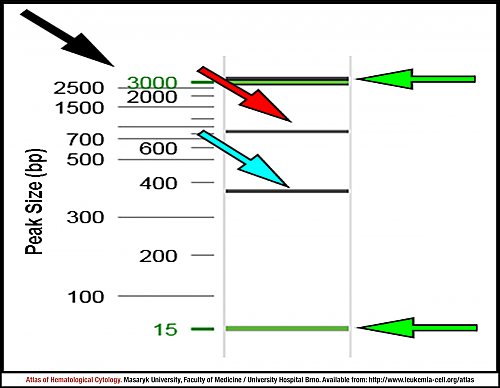
The figure shows PCR amplification products from a patient analysed for BCR-ABL1 transcript in a peripheral blood sample. PCR product about the size of 385 bp corresponds to e14a2 (b3a2) BCR-ABL1 transcript type (blue arrow). The red arrow marks an amplification corresponding to the non-fused BCR gene (size 808 bp). On the left, individual fragments of 100 bp – 2.5 kb of DNA size marker (black arrow) and two fragments of 15 bp and 3 kb of alignment marker (green arrow) are shown (digital output from QIAxcel ScreenGel Software, Qiagen).
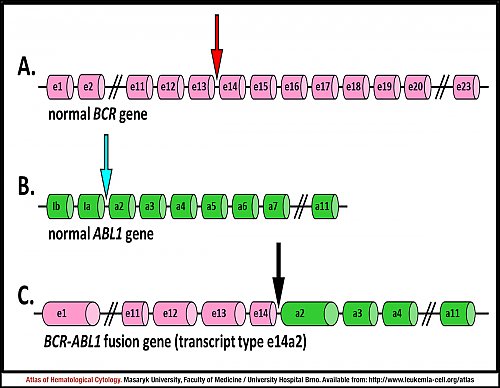
A. Genomic organisation of the BCR loci. The red arrow indicates a breakpoint within a major breakpoint cluster region (M-BCR) – between exons e13 (b2) and e14 (b3).
B. Genomic organisation of the ABL1 loci. The blue arrow indicates a typical breakpoint within the ABL1 gene – between exons Ia and a2.
C. Schematic diagram of the BCR-ABL1 fusion gene – transcript type e14a2 (b3a2). The black arrow marks a junction between the BCR (exon e14) and ABL1 (exon a2) genes.
Atlas of Haematological Cytology [online]. 2016 [cit. 2026-7-14]. Available from WWW: http://www.leukemia-cell.org/atlas.
2026 CELL - Atlas of Haematological Cytology | site map
 zoom picture
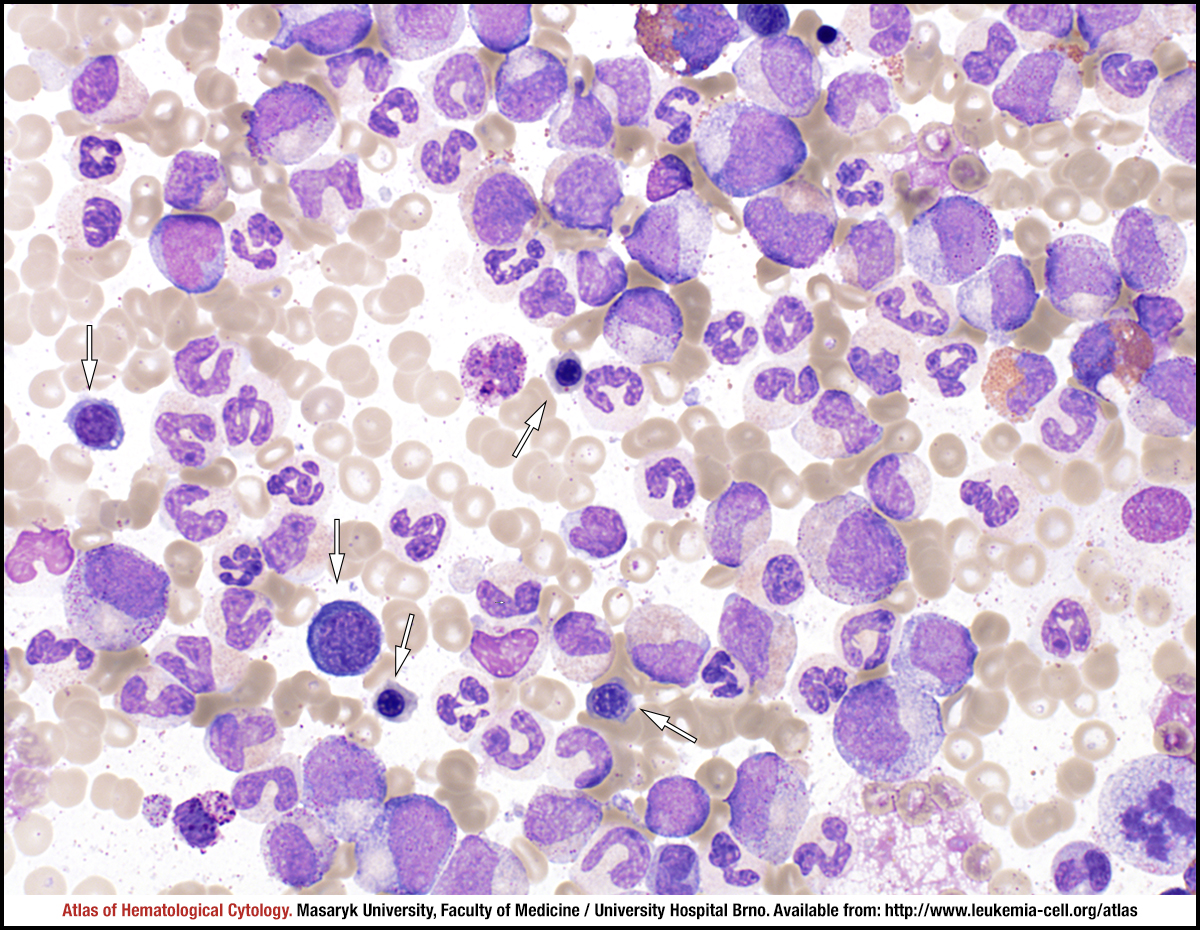 zoom picture
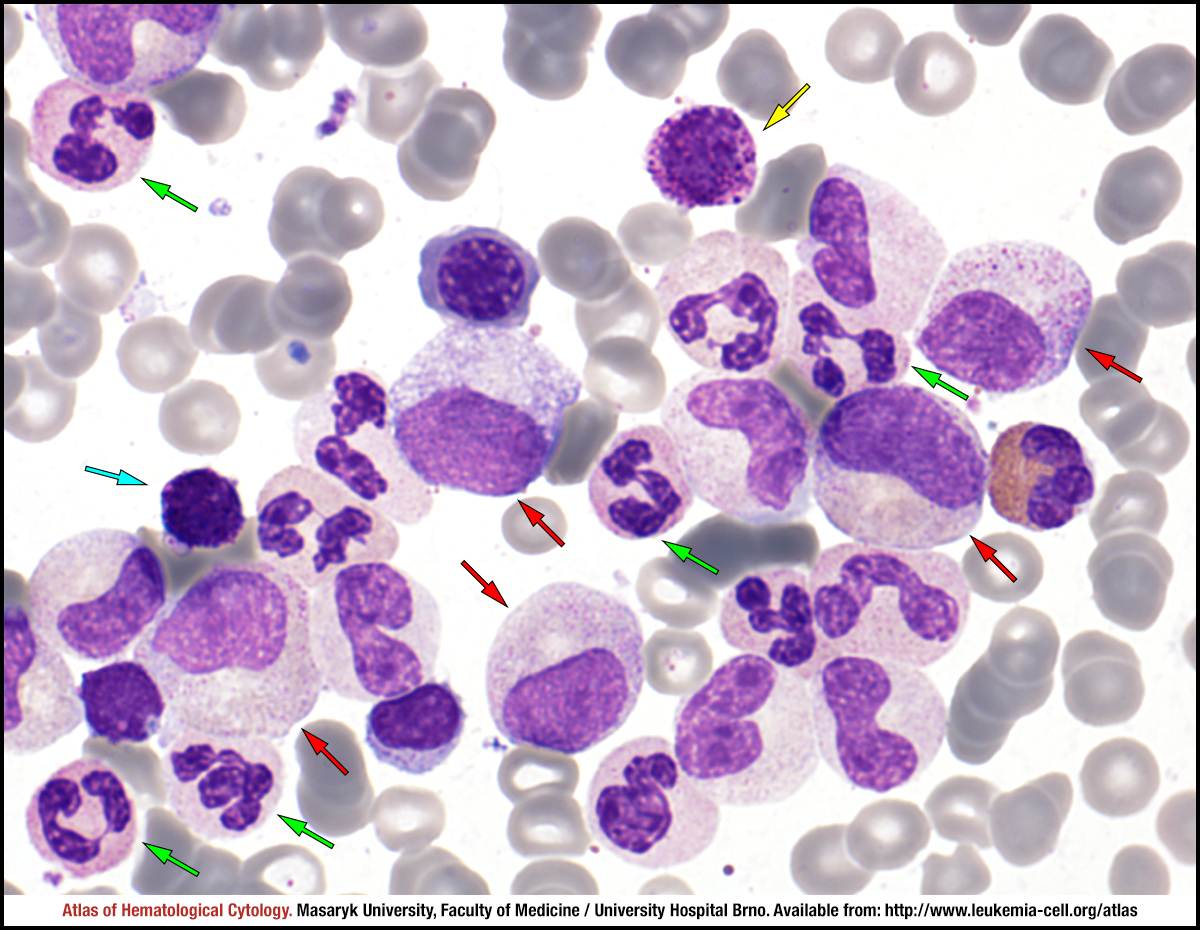 zoom picture
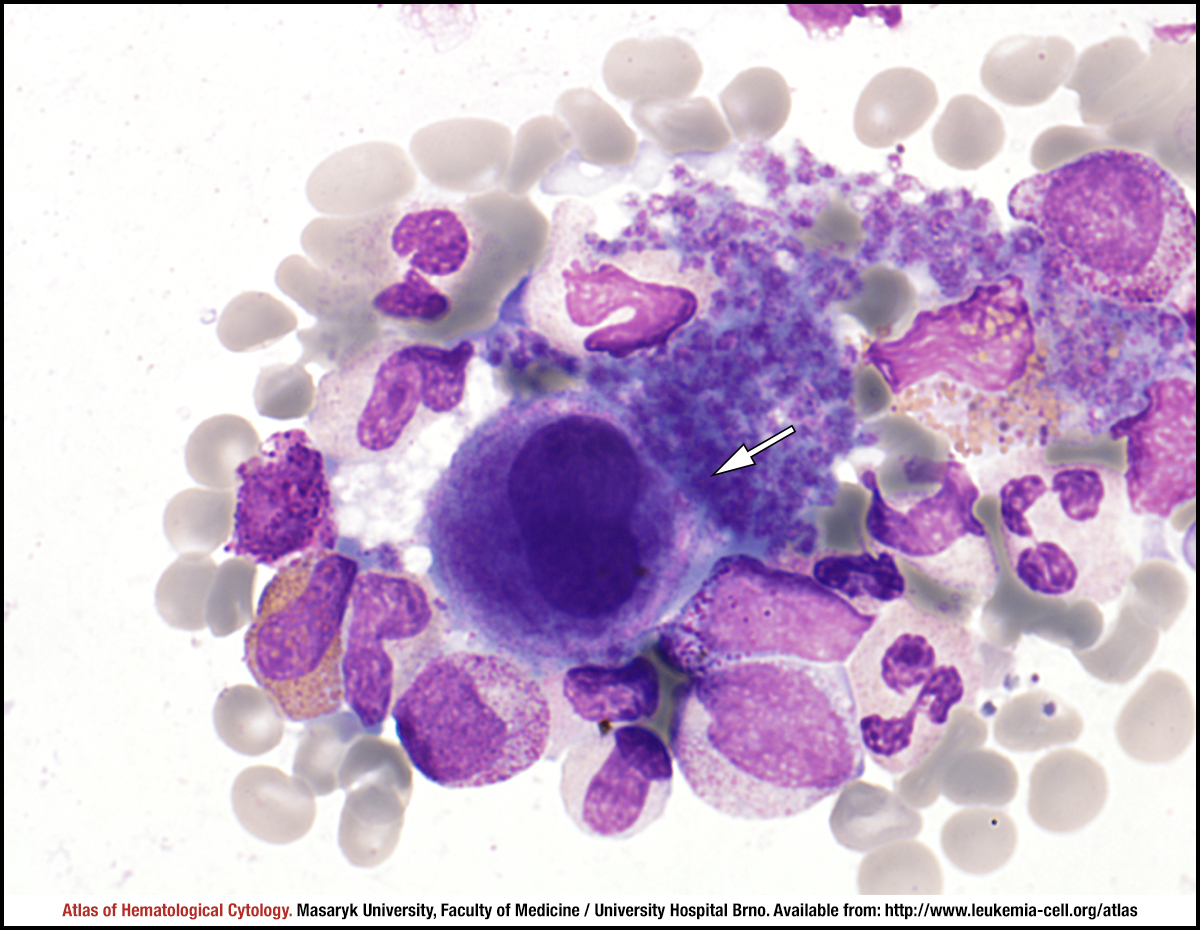 zoom picture
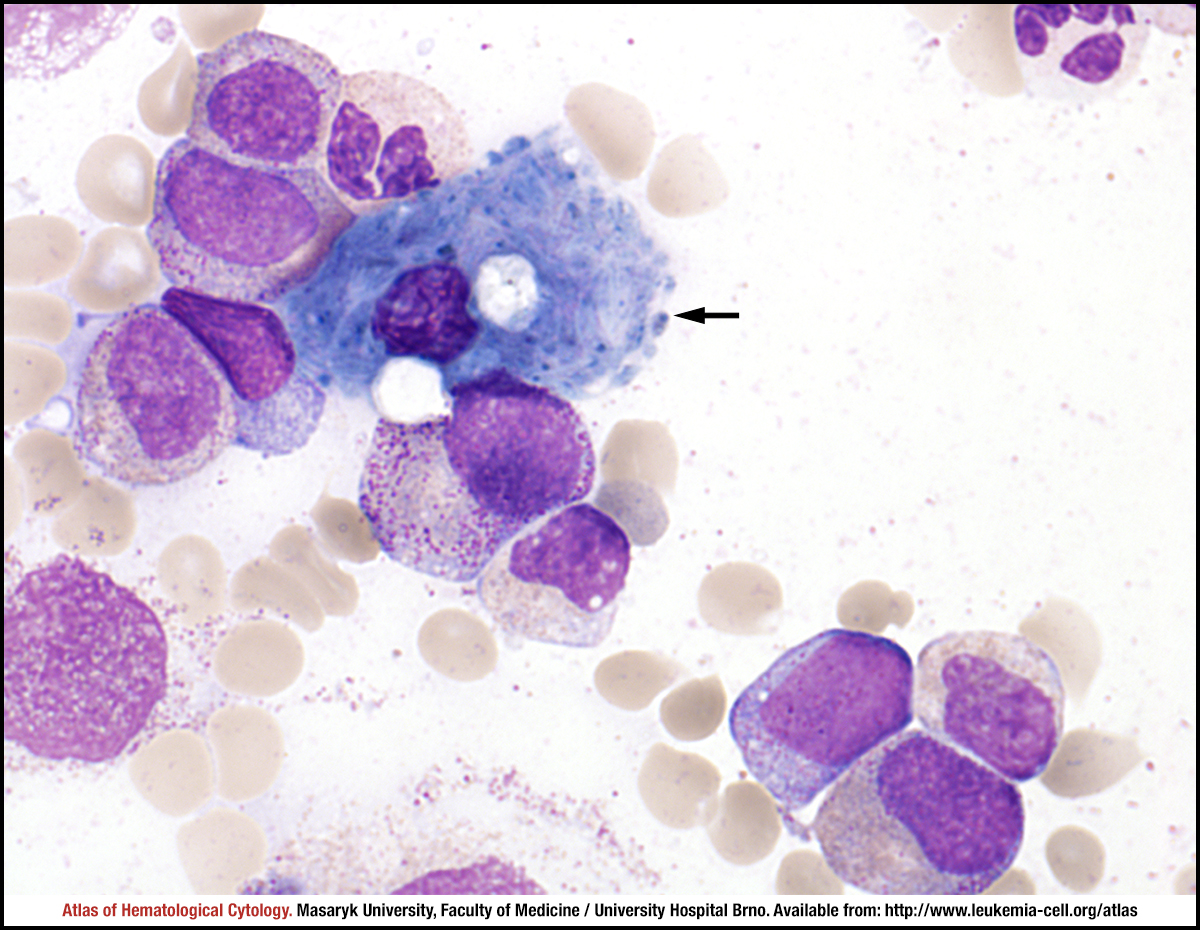 zoom picture
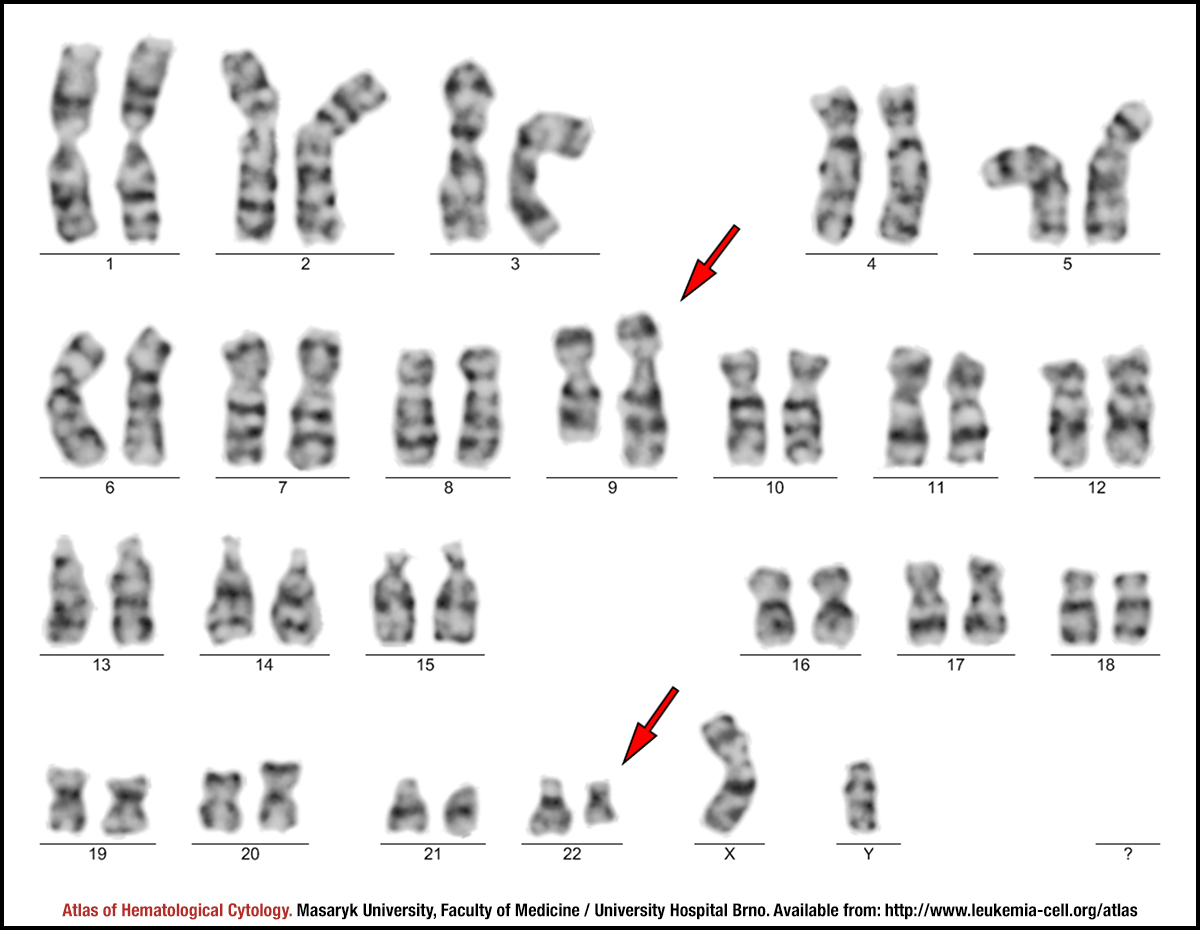 zoom picture
 zoom picture
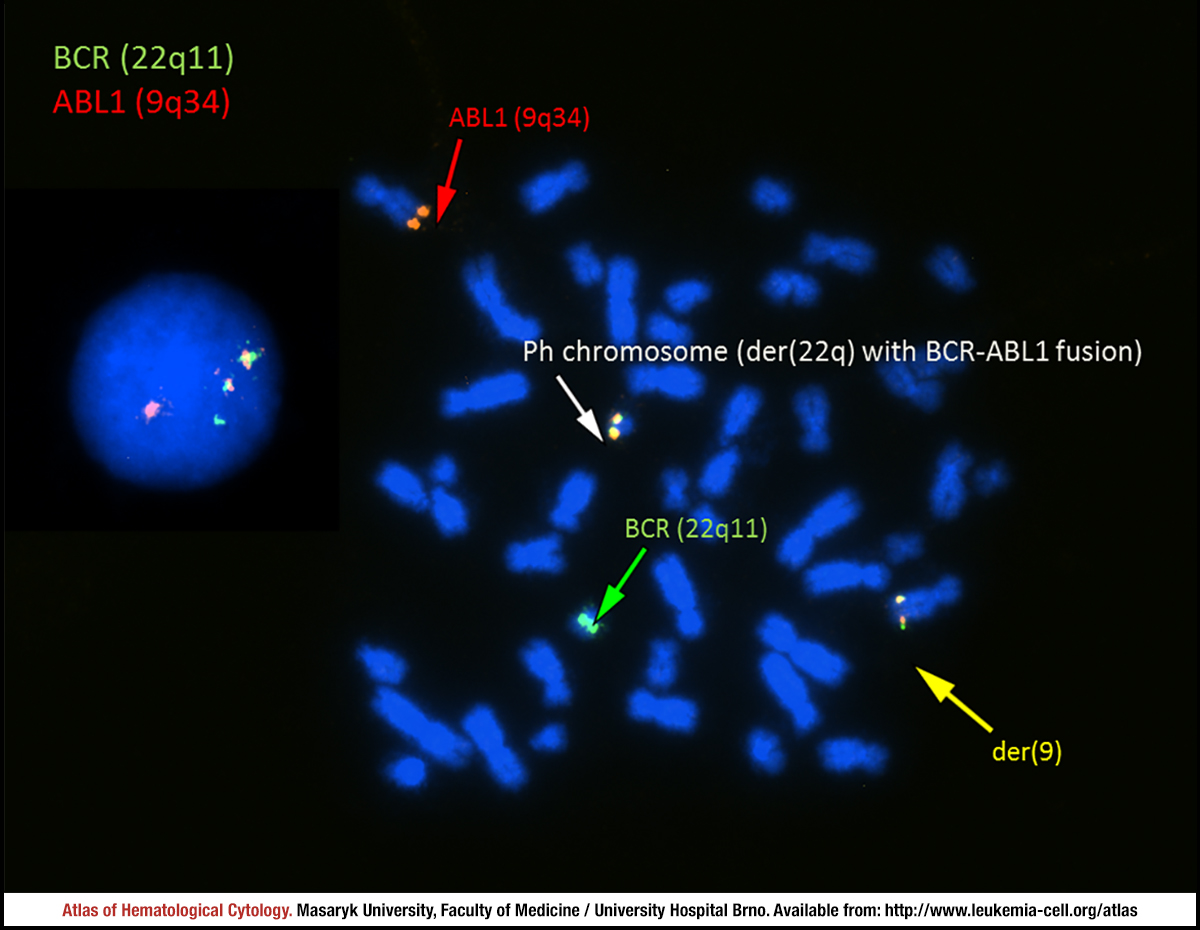 zoom picture
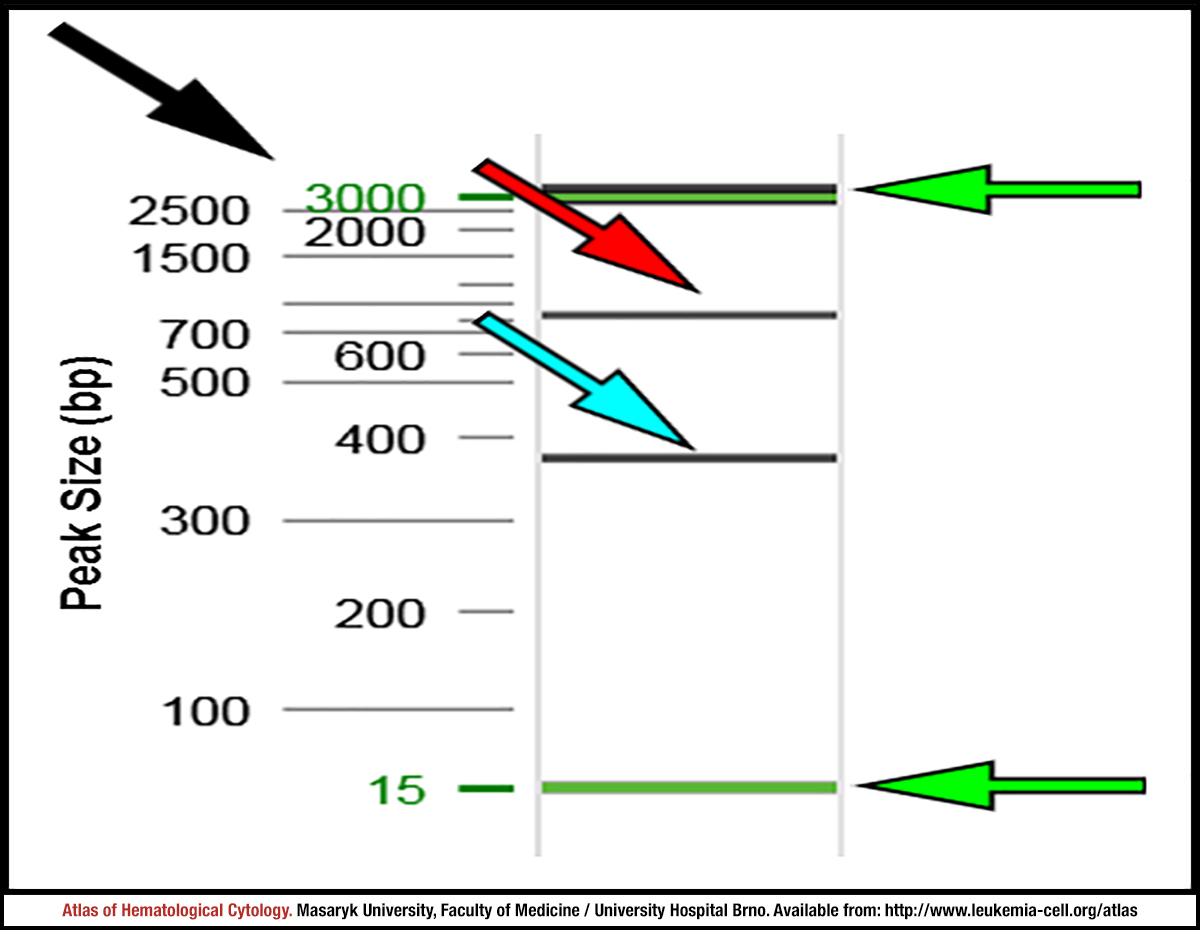 zoom picture
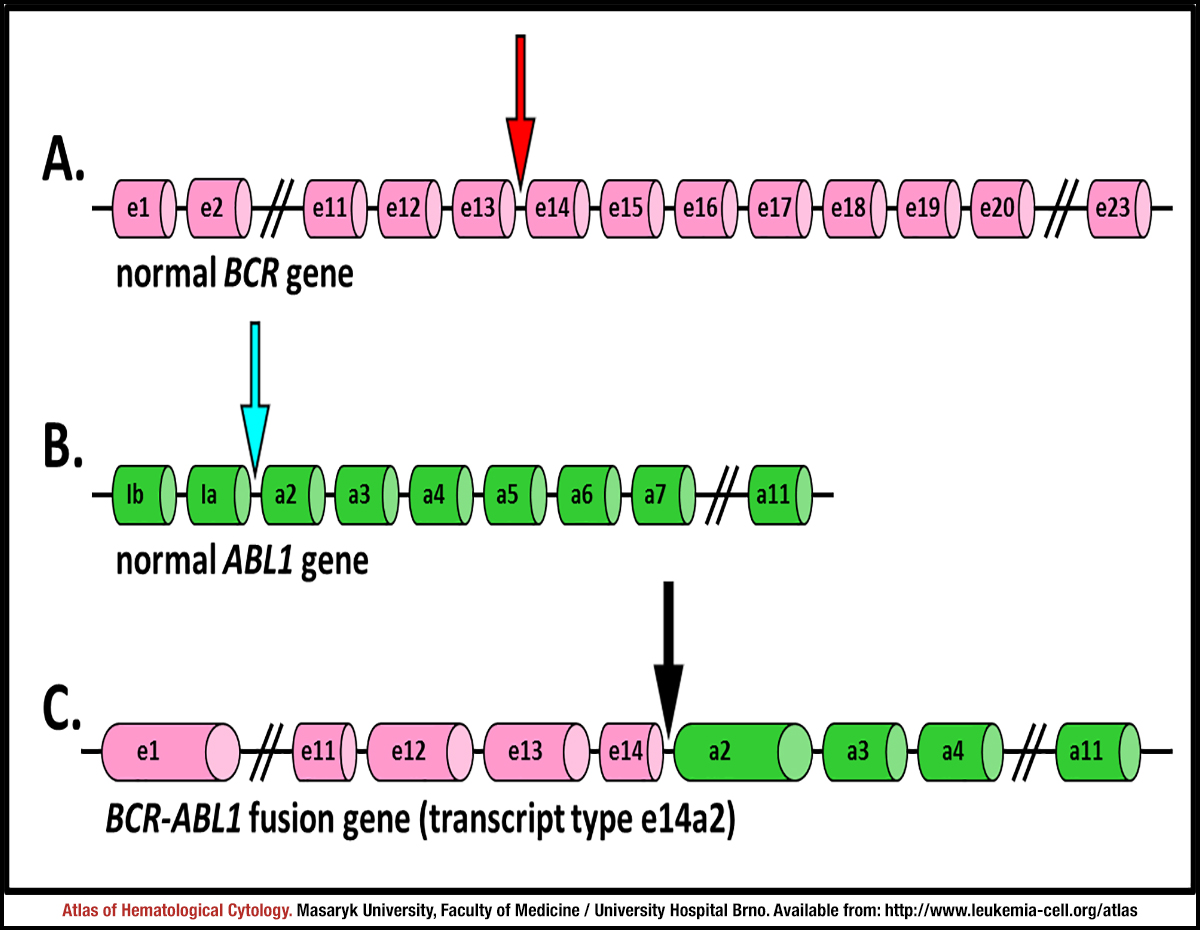 zoom picture